2008issue C011-11
A Relative Strength Index channel for profit lock and a trailing stop for capital protection
A historical workflow maps range-bound bias onto price as a channel, then treats a close below the upper cord after an overbought reading as the profit-locking exit. A separate trailing stop, and in a complementary pairing a Parabolic SAR trail, is reserved for capital protection.
- Map a range-bound bias measure onto price as a channel so overbought or unsustainable trend conditions are judged against the price path, not a detached oscillator pane.
- Treat a close below the upper cord of a bullish relative-price band after an overbought reading as the profit-locking exit, distinct from a close below a trailing stop used for capital protection.
- A nonreturning trailing stop can protect remaining capital, but it cannot by itself mark a profit-locking point that stays aligned with evolving trend development.
- One implementation builds the channel from a trader-chosen start date, a 34-period relative-price formula, an overbought region of 75, and a lower boundary from a bear-range trailing stop. A complementary pairing uses a Relative Strength Index style trigger with a Parabolic SAR trail.
Two jobs for the same exit
The archive presents a historical workflow that splits what is often treated as a single exit. One line marks when a bullish move looks overbought and no longer sustainable. Another line exists only to protect remaining capital.
A TradersWeek editorial reading is that these are two jobs, not one. The first job is a bias-based overbought line that can lock gains when the trend looks unsustainable. The second job is a trailing stop that does not try to time the profit-locking point. That reading is editorial and is not attributed to the archive.
Judge overbought conditions on the price path
Range-bound bias measures can be mapped onto price as a channel. Overbought or unsustainable trend conditions are then judged against the price path itself rather than against a detached oscillator pane.
The channel keeps the bias reading attached to the bars a trader already watches. The question is not only whether a detached pane looks stretched. The question is where that stretch sits on the price path.
Profit lock and capital protection use different closes
A close below the upper cord of a bullish relative-price band after an overbought reading is presented as the profit-locking exit. That close is distinct from a close below a trailing stop, which is used for capital protection.
A nonreturning trailing stop is described as a capital-protection device. It cannot, by itself, mark a profit-locking point that stays aligned with evolving trend development. The trail can stay on the chart after the profit-lock line has already done its job.
A channel from a start date and a bear-range lower bound
One software implementation builds the channel from a trader-chosen start date, a 34-period relative-price formula, an overbought region of 75, and a lower boundary taken from a bear-range trailing stop.
The upper work of the channel is the relative-price band used to judge overbought stretch. The lower boundary is taken from the trailing stop, so capital protection remains visible on the same structure that carries the profit-lock line.
Chubb daily: RSI profit-lock cord and bear-range capital stop
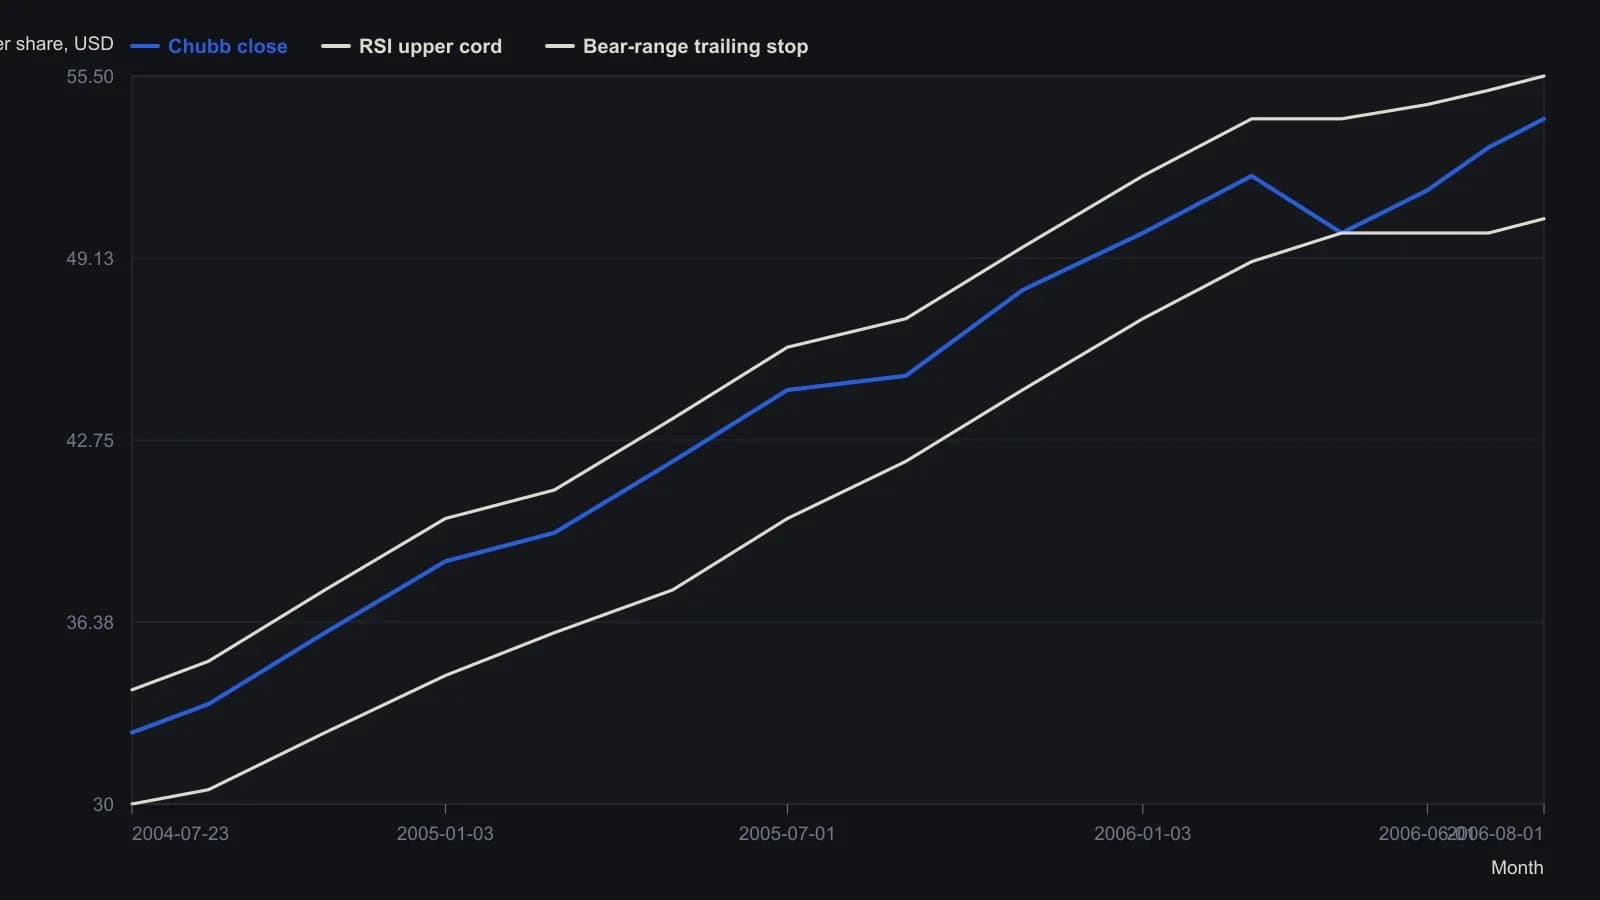
The screenshot prints Daily and a channel start of 23 July 2004. Month ticks run from July through a later August with a 2005 year mark; the second trip through the calendar is read as 2006. Y values are digitized to the nearest half dollar on a five-dollar grid, so intra-month swings are not resolved.
A Parabolic SAR trail keeps the second job on the chart
A complementary implementation pairs a Relative Strength Index style overbought or oversold trigger with a Parabolic SAR trail. Profit locking and capital protection remain separate decisions on the same chart.
The Relative Strength Index style trigger still marks the bias-based lock. The Parabolic SAR trail still does only the capital-protection job. The two lines are read together, not collapsed into one exit.
All readings on this track · 21 readings
- 1987Constructing parabolic stops and cycle-window averages
- 1989Evaluating always-in parabolic SAR trailing stops
- 1993Constructing parabolic time-price trailing stops
- 1995Constructing parabolic SAR as an accelerating trail
- 1995Constructing a noise-buffered parabolic trailing stop
- 1997Constructing a parabolic trailing stop that only tightens
- 1998Triangle breakouts filtered by an exponential average and exited with parabolic stops
- 2000Treat volume-price imbalance as a hypothesis and let Parabolic SAR hold the exit
- 2002Constructing volatility stops from average true range and parabolic SAR
- 2002Parabolic SAR construction from stop outputs to reversal signals
- 2002Always-in-market SAR trail with directional confirmation
- 2004Forex trend confirmation with Average Directional Index, Parabolic SAR, and trendlines
- 2006Permission and fill gates for mechanical systems
- 2008A Relative Strength Index channel for profit lock and a trailing stop for capital protection
- 2010Building loss limits from the parabolic stop-and-reverse plot
- 2015Dual-zone currency indexes filter parabolic SAR signals
- 2016A parabolic trailing stop is not a complete system
- 2019Assigning jobs in a stochastic, parabolic, and moving-average stack
- 2019A three-filter stack as a redundancy test
- 2020Mechanical Parabolic SAR as an always-in flip after a breakout
- 2020Layering Relative Strength Index, MACD, and Parabolic SAR onto relative rotation maps