2014issue C1319-21
Long-only RSI pullback, reversal-bar-entry, and staged-trail construction
The archive specifies a long-only swing workflow as separate gates. A 200-period exponential moving average trend-gate and a two-period rsi-reset only admit a name. A reversal-bar-entry is the sole trigger. A staged-trail must run before the average-exit can take over.
- Longs are admitted only while price holds above the 200-period exponential moving average trend-gate. The two-period rsi-reset is an oversold precondition, not the entry.
- The rule-based entry fires only after that reset, on a reversal-bar-entry that breaks a run of lower highs.
- After a fill, a staged-trail starts under the latest swing low and follows three-bar period lows until price recaptures a six-period exponential moving average. Only then does the average-exit apply.
- Hard screens, an earnings-overlay, four-week comparative ranking, sector spread, and a portfolio-heat bound sit around that trigger sequence.
How the construction is assembled
The archive describes a long-only swing procedure that keeps admission, entry, and exit on distinct rules. Price must remain above a 200-period exponential moving average before a name can be a long candidate. The construction treats that average as the trend-gate, the dominant-trend filter for the book.
While the trend-gate still holds, a two-period relative strength index reading below 5.00 is required as the rsi-reset. That print is an oversold precondition. It is not the entry signal.
UGI daily: 200-day gate, six-day average, and 38.42 trigger
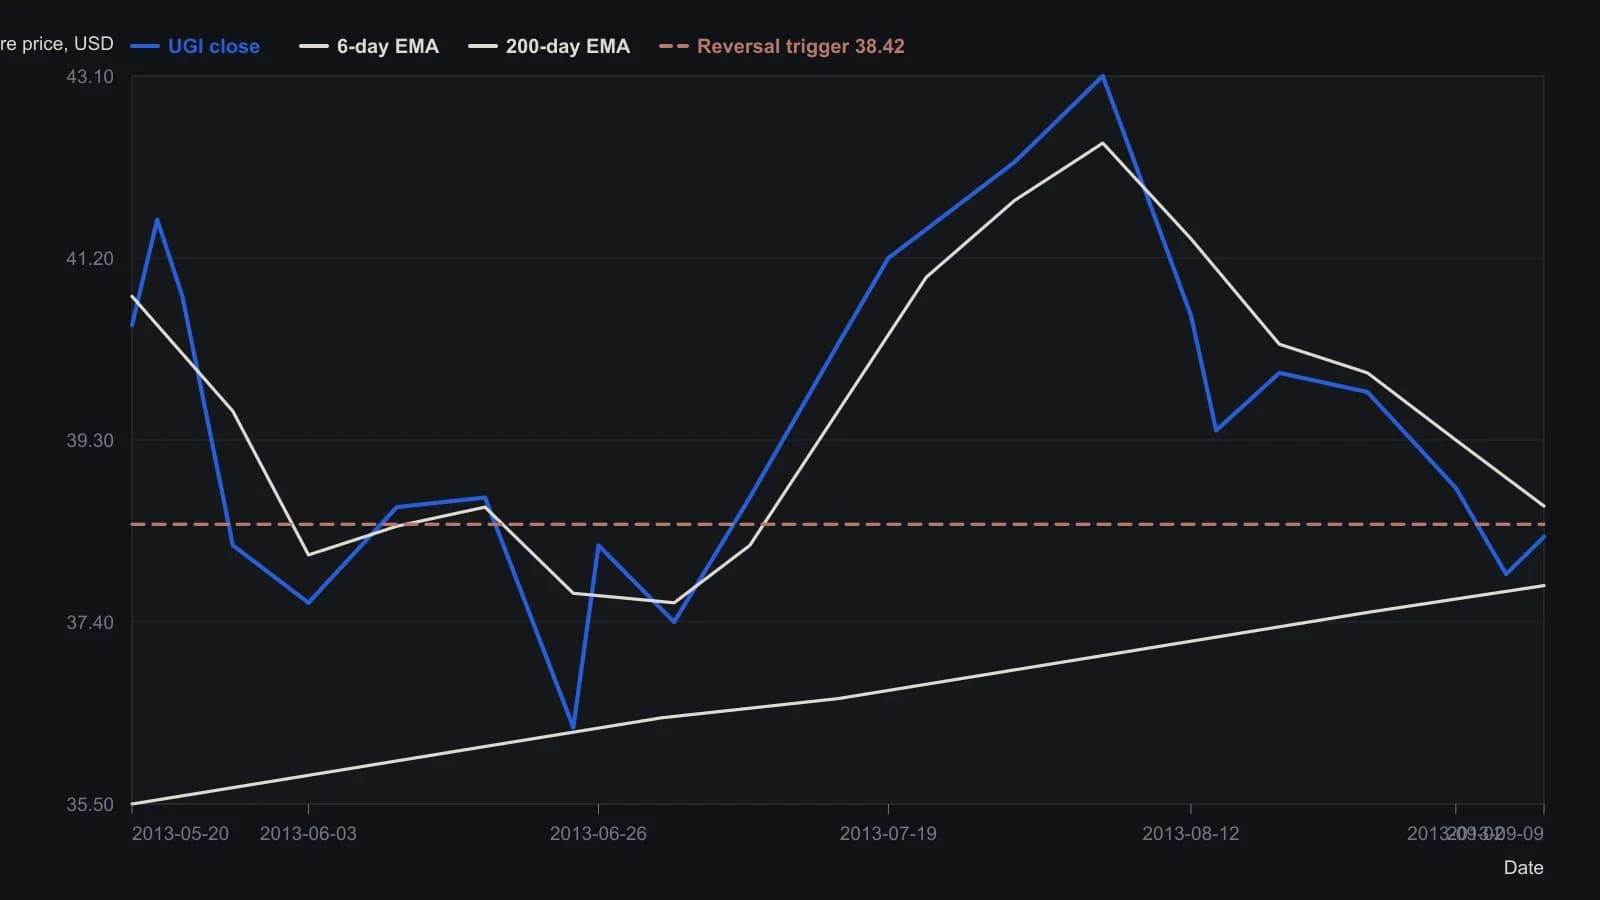
Earlier closes and average readings are approximate to 0.1 USD; the raster does not support ticks finer than that. Last-bar values and the 2.03 two-day RSI are the printed platform/article figures, not digitized. The chart annotation also writes the trigger as 38.45.
The only entry rule
The rule-based entry fires only after the rsi-reset. The trigger is a reversal-bar-entry: a bullish bar that breaks the preceding string of lower highs. If that bar has not printed, the system does not enter, even when the trend-gate and rsi-reset are already in place.
Staged-trail and average-exit
After a fill, risk starts under the most recent swing low. The staged-trail then follows the lowest low of the last three bars until price recaptures a six-period exponential moving average. On a 60-minute chart the trail uses hourly lows.
Once price is back above the six-period average, the average-exit holds the position until a close back below that average. At that close the system returns to cash.
Screens and the earnings-overlay
Liquidity and volatility screens require average volume of at least one million shares and beta above 1.00 versus the broad large-cap index. An earnings-overlay then restricts longs to names that recently beat quarterly earnings estimates and, preferably, show positive surprises over the prior eight to ten quarters.
Ranking, book, and portfolio-heat
After the hard screens, names are ranked by four-week comparative relative strength versus the broad index and by whether their industry group is also outperforming. Holdings are spread across sectors.
Portfolio construction discussed a four- to six-name book, a cap of two new positions per day, and a portfolio-heat bound near 4 to 5 percent. The long-term average is also used as a filter that reduces position count in severe bear markets.
Review cadence
The same scan-and-trigger framework is specified for 60-minute, daily, or weekly bars. The chosen bar length matches how often new positions are reviewed.
All readings on this track · 36 readings
- 1988Half-day bars, a midpoint gate, and a bar-based trail
- 1989Packaging two-bar reversals into testable entry and exit rules
- 1989Weekly high and low averages as stop-and-reverse levels
- 1991Constant false-alarm rate for dominant-cycle stops
- 1992Tick-index extremes as continuation and turn hypotheses
- 1993Constructing layered stops from equity and structure
- 1993Filter crossovers with moving-average slope
- 1993Precommit stop bounds from equity and structure
- 1998Evaluating a trendline barrier that can only tighten a capped stop
- 1999Constructing common-number support and resistance
- 2001Four-step opening-hour bias and trailing stops
- 2004Make the trading system the star
- 2005A beginner stock case: stop, trail, and the pre-trade checklist
- 2006Sell stops that trail support after the buy
- 2006Treat a wave-3 label as unfunded until the stop rails are written
- 2008Test medium-term divergence with a trendline break and a trailing stop
- 2010Rule-based forex entry, stop and trail
- 2012Precommitting stops when one currency range templates another
- 2012Cat-ears as a downtrend continuation hypothesis
- 2013Three-average swing entry and a trailing average exit
- 2014Construct a dual quotient-copy trend filter under a frequency roof
- 2014Stop distance, size, and trailing swing invalidation
- 2014Long-only RSI pullback, reversal-bar-entry, and staged-trail construction
- 2015Dual-average regime, trigger candle, and trail as one daily script
- 2015Three-gate trend system: filter, trigger, and trailing stop
- 2016Construct HHLLS crossover and breakout entry rules
- 2017An appointment-trade around a scheduled political close
- 2017Golden-cross breakout rules for a swing entry
- 2017Breakout confirmation above round numbers, with nines as sell shelves
- 2018Classify diamond geometry before the breakout
- 2019When trails and stops betray the support read
- 2019One-triggers-the-other pairs for preplanned swing entries
- 2019One-triggers-the-other orders for a breakout and its stop
- 2019When the second decision unbounds planned risk
- 2020Last-Hour Breakout With a Same-Session Flatten
- 2020Couple the slow period to stop-loss and trailing-stop settings