2016issue C0920-23
Smoothed RSI and full-cut pivots for option-income exits
A 10-day simple moving average of 14-day RSI is the constant-scale uptrend label used before any exit hunt. The first later full-cut of the prior high is treated as the end of that uptrend for limited-horizon option trades, with a downward turn in smoothed RSI as the failsafe when no cut prints.
- A 10-day simple moving average of 14-day RSI is the constant-scale uptrend label used before any exit hunt begins.
- A simplified pivot is allowed only after a new high replaces an old high and price then falls fully below that old high.
- The stacked rule treats smoothed RSI above 70 as permission and the first later full-cut as the end of that uptrend for limited-horizon option trades.
- If no full-cut appears, a downward turn in smoothed RSI is the failsafe; pivots are not sought in flat or inactive markets.
Label the uptrend first
The archive workflow treats exit design as a sequence, not a single print. A 10-day simple moving average of 14-day relative strength is the constant-scale label of whether an asset is in an uptrend. That label is read before any exit hunt begins.
A 14-period relative strength index is a bounded oscillator from ordered price history. Unsmoothed 14-day RSI is treated as too volatile on that same bounded scale to serve as a reliable trend label, which is why smoothing is applied first. Smoothed RSI is that 10-day average of standard RSI, used to label an uptrend rather than as a standalone sell trigger.
A full-cut is the only allowed pivot
A simplified pivot-point is defined only after a new high replaces an old high and price then falls fully below that old high. The full-cut rule requires price to undercut the prior high completely. Near-miss undercuts are treated as less reliable and are excluded.
Read the oscillator before the pivot
The stacked exit rule treats smoothed RSI above 70 as uptrend permission and the first later full-cut as the end of that uptrend. The oscillator is read before the pivot is sought. The first full-cut after that threshold is treated as trend-end information for limited-horizon option trades, even if later cuts print while the move finishes.
Convert the first print into one procedure
An option-income strategy is a single procedure that times a covered-call or similar income sale from the oscillator state, the first full-cut, or a downturn failsafe when no cut prints. If no full-cut appears, a downward turn in smoothed RSI is used as that failsafe exit. The illustrated overlay then sold TLT call options after that downturn.
Where the hunt is withheld
Pivots are not sought in flat or inactive markets. Daily reversal of the same rules for short covering is described as too slow, because bear markets can leave insufficient time for a proper daily signal.
An alternative permission test
An alternative uptrend test considered in the evidence is a rise of 20 or more points in smoothed RSI, rather than a crossing above 70.
TLT daily closes through the August 2015 full-cut pivots
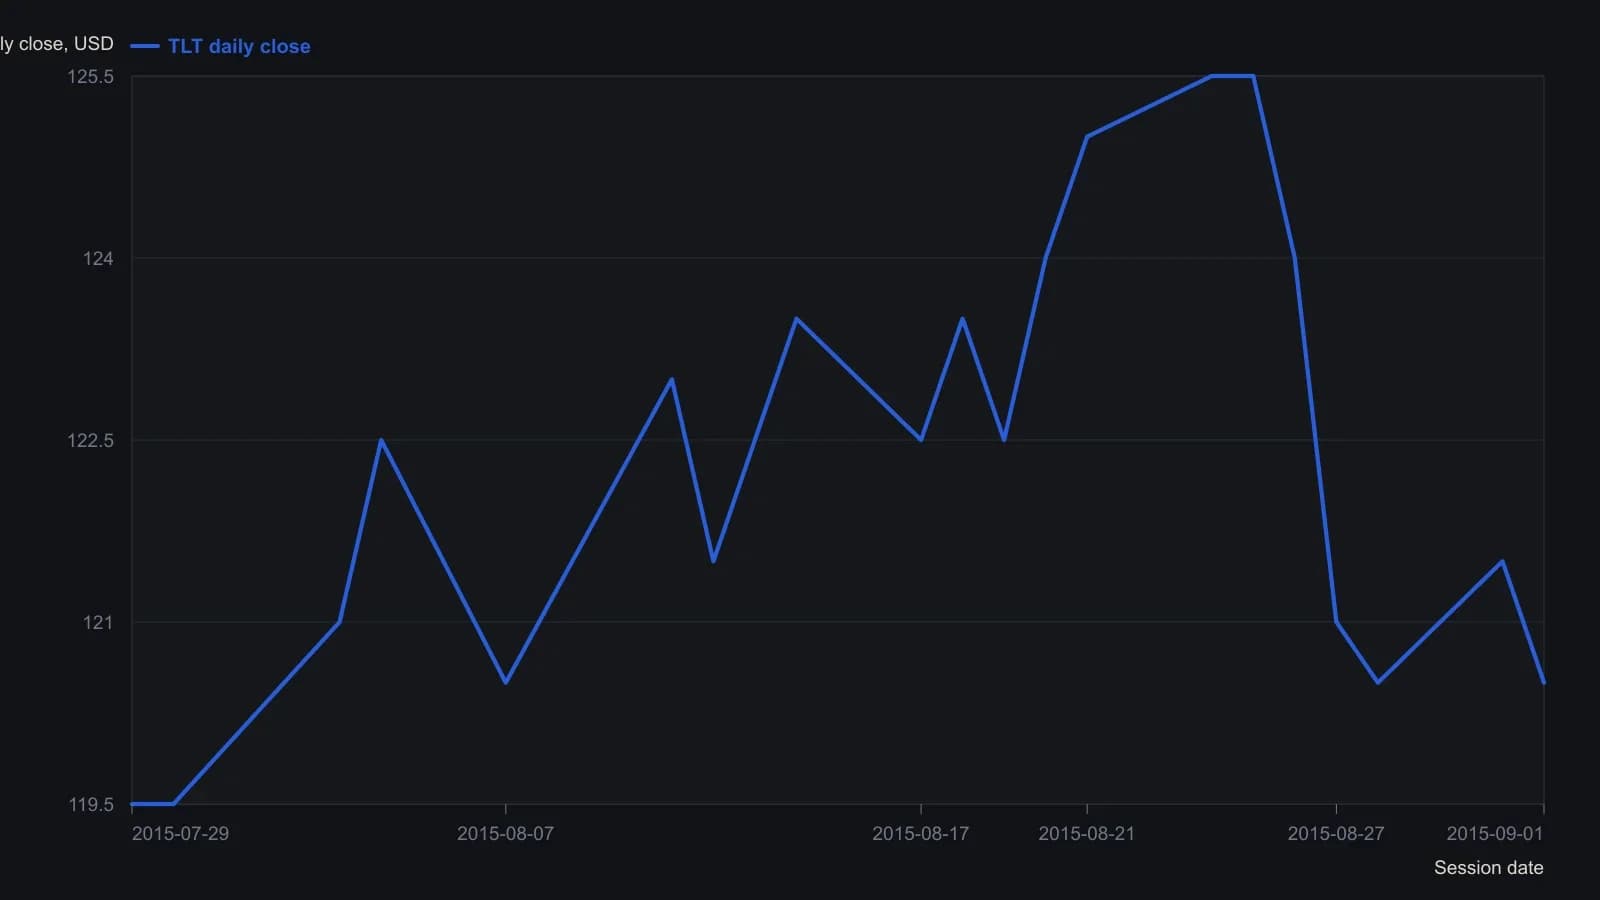
Smoothed RSI in the lower pane is a 10-day simple average of 14-day RSI; a simplified pivot is counted only on a full cut of the prior high, not a near-miss. Session dates are interpolated from the Aug 10, 17 and 24 axis marks, so alignment is approximate to a day.
All readings on this track · 38 readings
- 1988Constructing action-reaction lines from two pivots
- 1988Constructing intradaily point-and-figure boxes and pivot ladders
- 1991Constructing layered support and resistance from swings, pivots, and retracements
- 1994Three locks on a day-session order, then a staged exit
- 1994Building a five-level daily pivot grid
- 1996Constructing daily pivot points from session prices
- 1996Higher time frame balance points as a trend and band filter
- 1998Cup-with-handle construction rules
- 2000Pivot levels as a daily trade hypothesis
- 2001Construct a same-session polarity card around the daily pivot
- 2001Trading inside the cup-with-handle before the breakout
- 2005A lower-low rebound as one entry, abstention, and stop routine
- 2006Constructing session pivot maps from the prior high, low, and close
- 2006Constructing a pivot grid for stops and buy-stops
- 2006Monoparametric automatic trendline construction
- 2008Write the exit before the entry
- 2010Dynamic-pivot range grids for trend bias
- 2010Reverse-entry exits for pairs, pivots and support
- 2011Sequencing pairs, futures pivots, and implied volatility
- 2013Constructing Camarilla levels from prior range
- 2013Camarilla levels as a multi-timeframe map of reversion and breakout
- 2013Constructing a camarilla-grid from a completed lookback range
- 2013Constructing daily pivot support and resistance rungs
- 2014Constructing daily pivot levels from prior-session OHLC
- 2014Next-session pivot support and resistance from daily bars
- 2014Constructing session pivot rails from the prior-day range
- 2014Evaluating moving-average, pivot, and support-resistance filters
- 2016Stage a Trailing stop toward a planned target
- 2016Smoothed RSI and full-cut pivots for option-income exits
- 2017Constructing a weekly seasonality pivot scaffold
- 2017Seasonality and pivot points as scenario maps, not forecasts
- 2018Wave pivots, strength filters, and option premium
- 2018Constructing Fibonacci and daily pivot support maps
- 2018Building a daily pivot lattice with Fibonacci rails
- 2019Prior-session pivot channels for same-day entries
- 2019Constructing intraday pivot channels from prior-session levels
- 2020Variable-strength pivot highs as falsifiable entry filters
- 2020A high-volume-pivot long after a multi-week decline