1994issue C061-3
Three locks on a day-session order, then a staged exit
A day-session combination stays silent until price sits on a precomputed pivot map, on-balance volume disagrees with the approach into that price, and a rising-volume contracting-range bar arms the order. After a fill, size is reduced in stages so the last unit can be managed separately from the first.
- A precomputed range map from the prior day's high, low, and close names the only prices at which the other conditions may trigger a decision.
- When price sits on a projected level, an on-balance-volume split is required before a rising-volume contracting-range bar may arm an order.
- The range-to-volume reading chooses when and at what price to enter, add, or exit. It does not replace the levels set beforehand.
- After a fill, a stop is placed and a multi-contract position is reduced in stages so remaining size can be managed separately from the initial risk.
Silence until every lock opens
This archive workflow is a combination rather than a single trigger. Before an order is considered, price must sit on a precomputed range map taken from the prior day. On-balance volume must then split from the approach into that price. Only a rising-volume contracting-range bar may arm the order.
On-balance volume is used together with the range-to-volume reading. The reading is restricted to choosing when and at what price to enter, add, or exit at levels set beforehand.
A precomputed map of the only legal prices
Next-session support and resistance are projected from the prior day's high, low, and close. The pivot is their average. First support and resistance flip the opposite extreme around twice the pivot, and further levels add or subtract the prior day's range.
Those numbers are calculated before the session. They are treated as the only prices at which the other conditions may trigger a decision.
On-balance volume as the second lock
On-balance volume is a running volume total that adds volume on up bars and subtracts it on down bars. Here it is used as an intraday line that either agrees with price or splits from it.
Divergence is a split between the direction of price and the on-balance-volume line. That split is required when price is sitting on a projected range level.
The bar that may arm an order
A range-to-volume reading is formed by dividing a bar's high-to-low range by that bar's volume, then comparing the result with the prior bar. The comparison judges whether price travel per unit of volume is expanding or contracting.
Four bar states are produced by pairing whether volume rose or fell with whether that range-to-volume reading rose or fell. A bar with rising volume and a falling range-to-volume reading is treated as expanding participation against a shrinking range, and that is the bar type used for entry and exit decisions. A bar with both volume and the reading rising is treated as trend confirmation.
A rising-volume contracting-range bar is one in which volume increases while the range-to-volume reading falls, implying more activity is producing less price travel.
How an order is placed
When price reaches a projected range level, the process looks for intraday on-balance-volume divergence and then waits for a rising-volume, falling range-to-volume bar. The order is placed two ticks beyond the bar that preceded that signal.
A break through the level cancels the setup.
What one five-minute session showed
An illustrated five-minute Treasury bond futures session shows a decline confirmed by on-balance volume. A later advance through the day's pivot was accompanied by on-balance-volume divergence. A rising-volume narrow-range bar then formed near that pivot before the rally failed.
Five-minute June T-bonds reverse at the 109-04 pivot
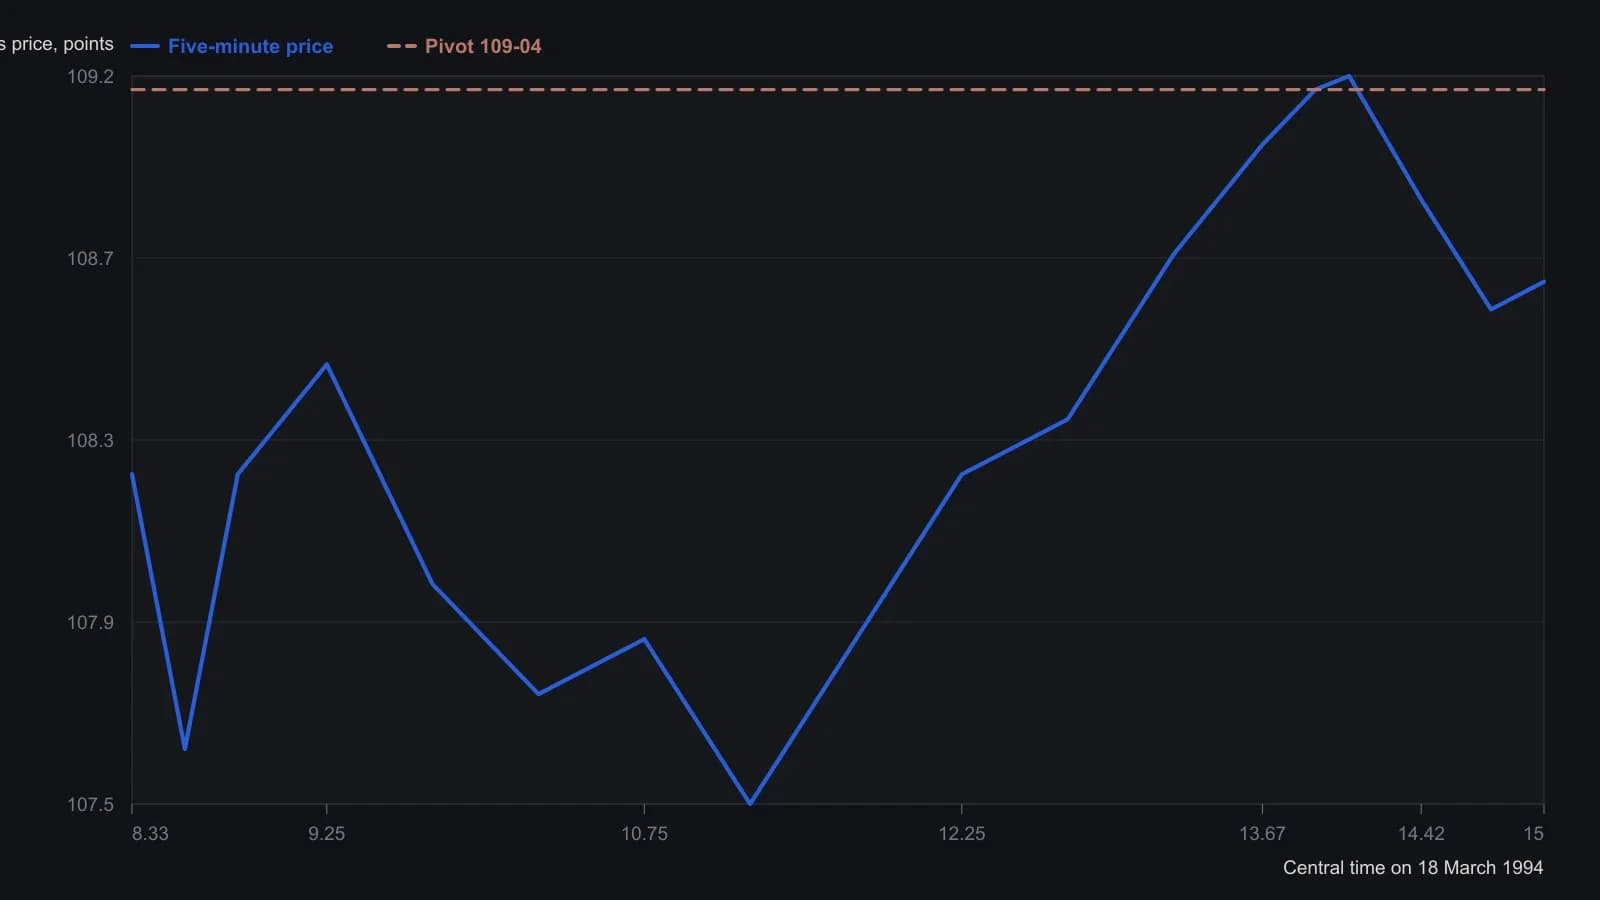
The source figure overlays on-balance volume with no numeric scale, so that line is not plotted. Prices other than the stated pivot, one-tick high, and close are approximate readings from a coarse printed raster, rounded to 4/32nds. Clock stamps follow the CBOT day session implied by the figure.
The last unit is managed separately
After a fill, a stop is placed and a multi-contract position is reduced in stages so later remaining size can be managed separately from the initial risk.
Editorial interpretation: scaling the exit is part of the same combination. The last unit is not kept on the same management as the first.
All readings on this track · 38 readings
- 1988Constructing action-reaction lines from two pivots
- 1988Constructing intradaily point-and-figure boxes and pivot ladders
- 1991Constructing layered support and resistance from swings, pivots, and retracements
- 1994Three locks on a day-session order, then a staged exit
- 1994Building a five-level daily pivot grid
- 1996Constructing daily pivot points from session prices
- 1996Higher time frame balance points as a trend and band filter
- 1998Cup-with-handle construction rules
- 2000Pivot levels as a daily trade hypothesis
- 2001Construct a same-session polarity card around the daily pivot
- 2001Trading inside the cup-with-handle before the breakout
- 2005A lower-low rebound as one entry, abstention, and stop routine
- 2006Constructing session pivot maps from the prior high, low, and close
- 2006Constructing a pivot grid for stops and buy-stops
- 2006Monoparametric automatic trendline construction
- 2008Write the exit before the entry
- 2010Dynamic-pivot range grids for trend bias
- 2010Reverse-entry exits for pairs, pivots and support
- 2011Sequencing pairs, futures pivots, and implied volatility
- 2013Constructing Camarilla levels from prior range
- 2013Camarilla levels as a multi-timeframe map of reversion and breakout
- 2013Constructing a camarilla-grid from a completed lookback range
- 2013Constructing daily pivot support and resistance rungs
- 2014Constructing daily pivot levels from prior-session OHLC
- 2014Next-session pivot support and resistance from daily bars
- 2014Constructing session pivot rails from the prior-day range
- 2014Evaluating moving-average, pivot, and support-resistance filters
- 2016Stage a Trailing stop toward a planned target
- 2016Smoothed RSI and full-cut pivots for option-income exits
- 2017Constructing a weekly seasonality pivot scaffold
- 2017Seasonality and pivot points as scenario maps, not forecasts
- 2018Wave pivots, strength filters, and option premium
- 2018Constructing Fibonacci and daily pivot support maps
- 2018Building a daily pivot lattice with Fibonacci rails
- 2019Prior-session pivot channels for same-day entries
- 2019Constructing intraday pivot channels from prior-session levels
- 2020Variable-strength pivot highs as falsifiable entry filters
- 2020A high-volume-pivot long after a multi-week decline