1998issue C101-6
Cup-with-handle construction rules
The cup-with-handle is written here as sequential price points, a handle-depth-limit, volume-price confirmation, and a watchlist-only pivot breakout.
- Build the cup-with-handle from sequential points K, A, B, C, and D, and treat C as the pivot-point that a later close at E must exceed.
- Keep the shape screenable with PK < PA, PB < PA, PC <= PA, PB < PC, and PD <= PC, plus a handle-depth-limit that holds D above the 80% mark of the B-to-C range.
- Require volume-price analysis: expanding volume on the right-cup rise, diminishing volume on the handle, and breakout volume at least 50% above the prior 50-day average.
- Use the screen as a watchlist, not a buy list, because many completed constructions never break the pivot and can roll into a failed right shoulder.
A cup-with-handle as named price points
A cup-with-handle is a rounded decline-and-recovery plus a lighter-volume pullback used as a pre-breakout construction. In the historical workflow it is built as a peak, a decline into a base, a rise back toward that peak, then a lighter pullback whose right-cup high is the pivot price.
A complete construction can be labeled with five sequential price points K, A, B, C, and D, plus a later breakout point E above C. The pivot-point is the right-cup peak C. It defines the buy or breakout price a later close must exceed.
Idealized cup-with-handle with named turning points
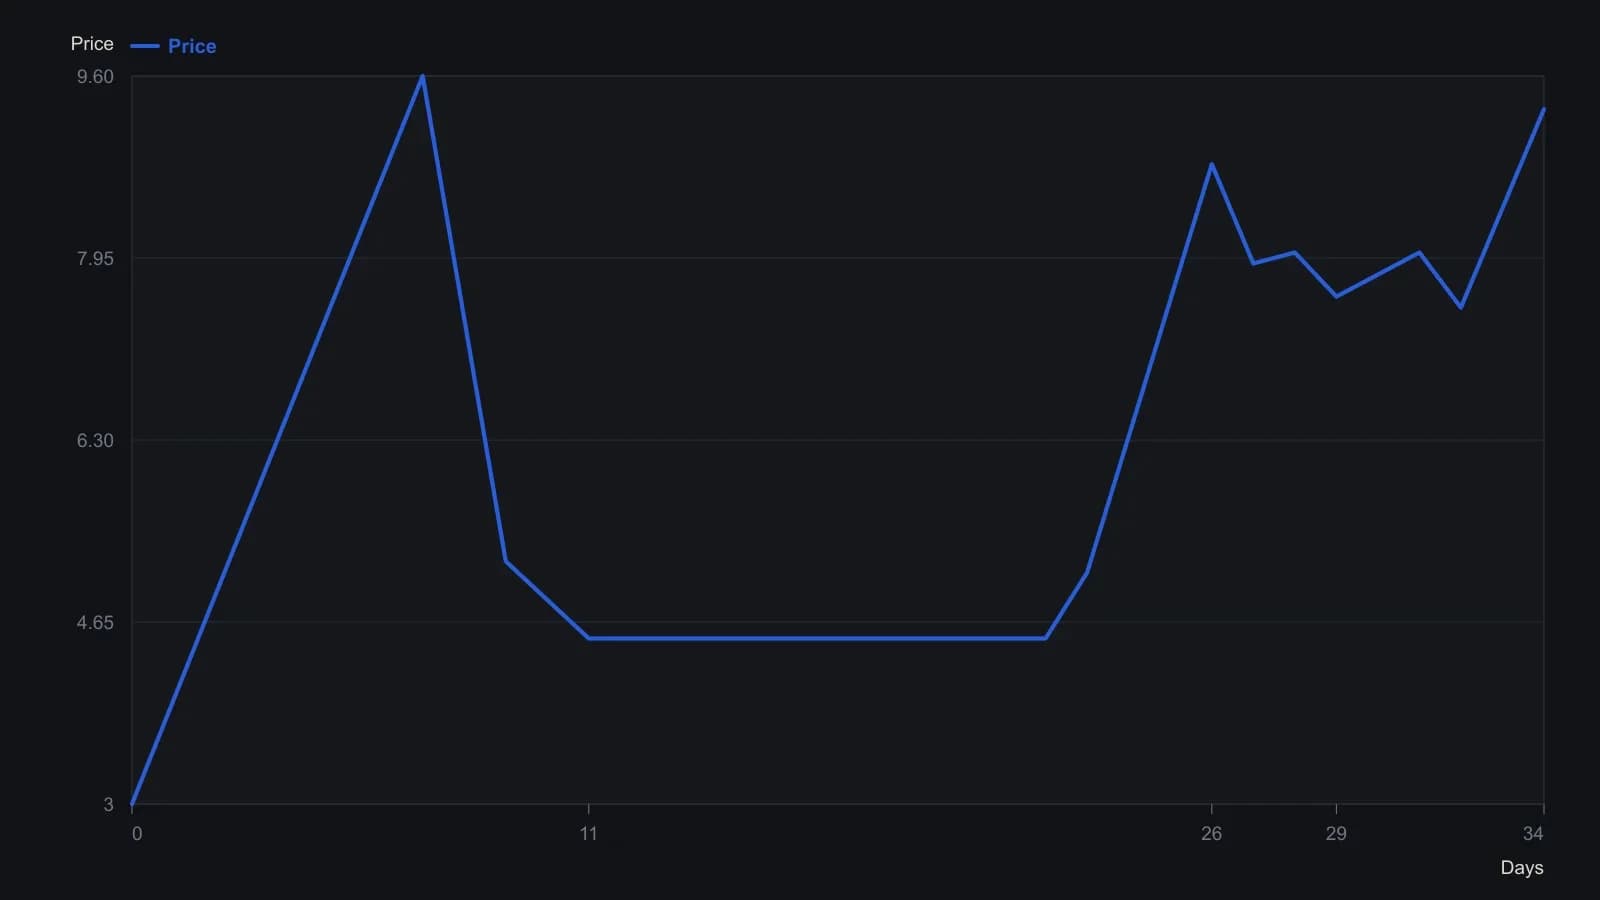
The source presents this as a highly idealized price-volume schematic, not a live stock. Volume bars share the same 0–10 pane and were not digitized. Point labels K, A, B, C, D and E follow the article’s naming.
Price inequalities that encode the shape
The price inequalities PK < PA, PB < PA, PC <= PA, PB < PC, and PD <= PC encode the cup-and-handle geometry for screening.
TradersWeek editorial: those named points and inequalities are how the freehand cup-with-handle becomes a computer-checkable construction a screen can accept or reject.
A handle-depth-limit on the last print
To reject handles that have fallen too far, the last handle print D must remain above the 80% mark of the range between the cup bottom B and the pivot C. That handle-depth-limit is the rule that the last handle print stay above a stated fraction of the cup-bottom-to-pivot range.
Volume-price analysis around the pivot
Price structure alone is treated as insufficient. The construction also requires expanding volume on the right-cup rise and diminishing volume on the handle decline. Volume-price analysis compares up-day and down-day volume across the right cup and handle to test whether demand is expanding into the pivot.
A breakout is a move above the pivot on volume large enough to confirm the setup rather than merely complete the shape. One stated breakout-volume test is that volume on the move through the pivot should be at least 50% above the prior 50-day average volume.
A watchlist, not a buy list
A computerized screen is framed as a watchlist filter, not a buy list, because many completed constructions never break the pivot and can instead roll into a failed right shoulder. A watchlist-not-buy-list candidate still requires a later pivot break and volume confirmation before any action.
When a later high resets the pivot
If a later high resets the right-cup peak, the pivot price is updated to that new high and the breakout test is applied to the revised level.
All readings on this track · 38 readings
- 1988Constructing action-reaction lines from two pivots
- 1988Constructing intradaily point-and-figure boxes and pivot ladders
- 1991Constructing layered support and resistance from swings, pivots, and retracements
- 1994Three locks on a day-session order, then a staged exit
- 1994Building a five-level daily pivot grid
- 1996Constructing daily pivot points from session prices
- 1996Higher time frame balance points as a trend and band filter
- 1998Cup-with-handle construction rules
- 2000Pivot levels as a daily trade hypothesis
- 2001Construct a same-session polarity card around the daily pivot
- 2001Trading inside the cup-with-handle before the breakout
- 2005A lower-low rebound as one entry, abstention, and stop routine
- 2006Constructing session pivot maps from the prior high, low, and close
- 2006Constructing a pivot grid for stops and buy-stops
- 2006Monoparametric automatic trendline construction
- 2008Write the exit before the entry
- 2010Dynamic-pivot range grids for trend bias
- 2010Reverse-entry exits for pairs, pivots and support
- 2011Sequencing pairs, futures pivots, and implied volatility
- 2013Constructing Camarilla levels from prior range
- 2013Camarilla levels as a multi-timeframe map of reversion and breakout
- 2013Constructing a camarilla-grid from a completed lookback range
- 2013Constructing daily pivot support and resistance rungs
- 2014Constructing daily pivot levels from prior-session OHLC
- 2014Next-session pivot support and resistance from daily bars
- 2014Constructing session pivot rails from the prior-day range
- 2014Evaluating moving-average, pivot, and support-resistance filters
- 2016Stage a Trailing stop toward a planned target
- 2016Smoothed RSI and full-cut pivots for option-income exits
- 2017Constructing a weekly seasonality pivot scaffold
- 2017Seasonality and pivot points as scenario maps, not forecasts
- 2018Wave pivots, strength filters, and option premium
- 2018Constructing Fibonacci and daily pivot support maps
- 2018Building a daily pivot lattice with Fibonacci rails
- 2019Prior-session pivot channels for same-day entries
- 2019Constructing intraday pivot channels from prior-session levels
- 2020Variable-strength pivot highs as falsifiable entry filters
- 2020A high-volume-pivot long after a multi-week decline