2013issue C0310-16
Camarilla levels as a multi-timeframe map of reversion and breakout
A historical Camarilla workflow maps the prior session high, low, and close into fade, warning, stop, and exit levels. The same grid is read across several time windows, and an Elliott wave count is used when a range plan no longer holds.
- Camarilla points are a specialized pivot-point map: several support and resistance levels taken from the prior session high, low, and close of a chosen time frame.
- The S3-R3 band is the primary fade and target pair. S4 and R4 first protect those fades and then trigger breakouts, while S5 and R5 are reserved as exclusive-Camarilla exits.
- The chosen window must keep S3 and R3 inside the market's hitting range. The archive applies the same map on 25-day, 15-day, 19-day, and 3-day windows, including a 4 to 28 September 2012 look-ahead on the DJIA and S&P 500.
- The archive presents Camarilla levels as better suited to range conditions than to runaway breakouts, which it more often handles with an Elliott wave count.
What the Camarilla map is built from
Camarilla points are a specialized pivot-point construction. They locate multiple support and resistance levels from the prior session high, low, and close of a chosen time frame.
They sit inside the broader pivot-point idea that markets oscillate around a prior-session equilibrium. The Camarilla grid then turns that balance into fade, warning, stop, and exit levels.
Editorial: those range multiples can also be read as a Fibonacci retracement style measurement. They locate the inner reversal band and the outer stop and exit bands without a standalone Fibonacci overlay in the archive examples.
Fade, stop, breakout, and warning levels
The inner S3 and R3 levels are the primary fade and target pair. If the session opens inside the S3-R3 band, the plan waits for a test of either band. If the session opens outside that band, the plan waits for a retreat through S3 or R3 toward the opposite side.
S4 and R4 function first as protective stops for S3 and R3 reversal trades. If price continues through them, they become breakout entry levels. S5 and R5 then serve as exclusive-Camarilla exits on those breakouts.
R2 and S2 are warning levels. A long is not opened at R2, and a short is not opened at S2.
DJIA Camarilla grid for the 25-day window of 24 April–29 May 2012
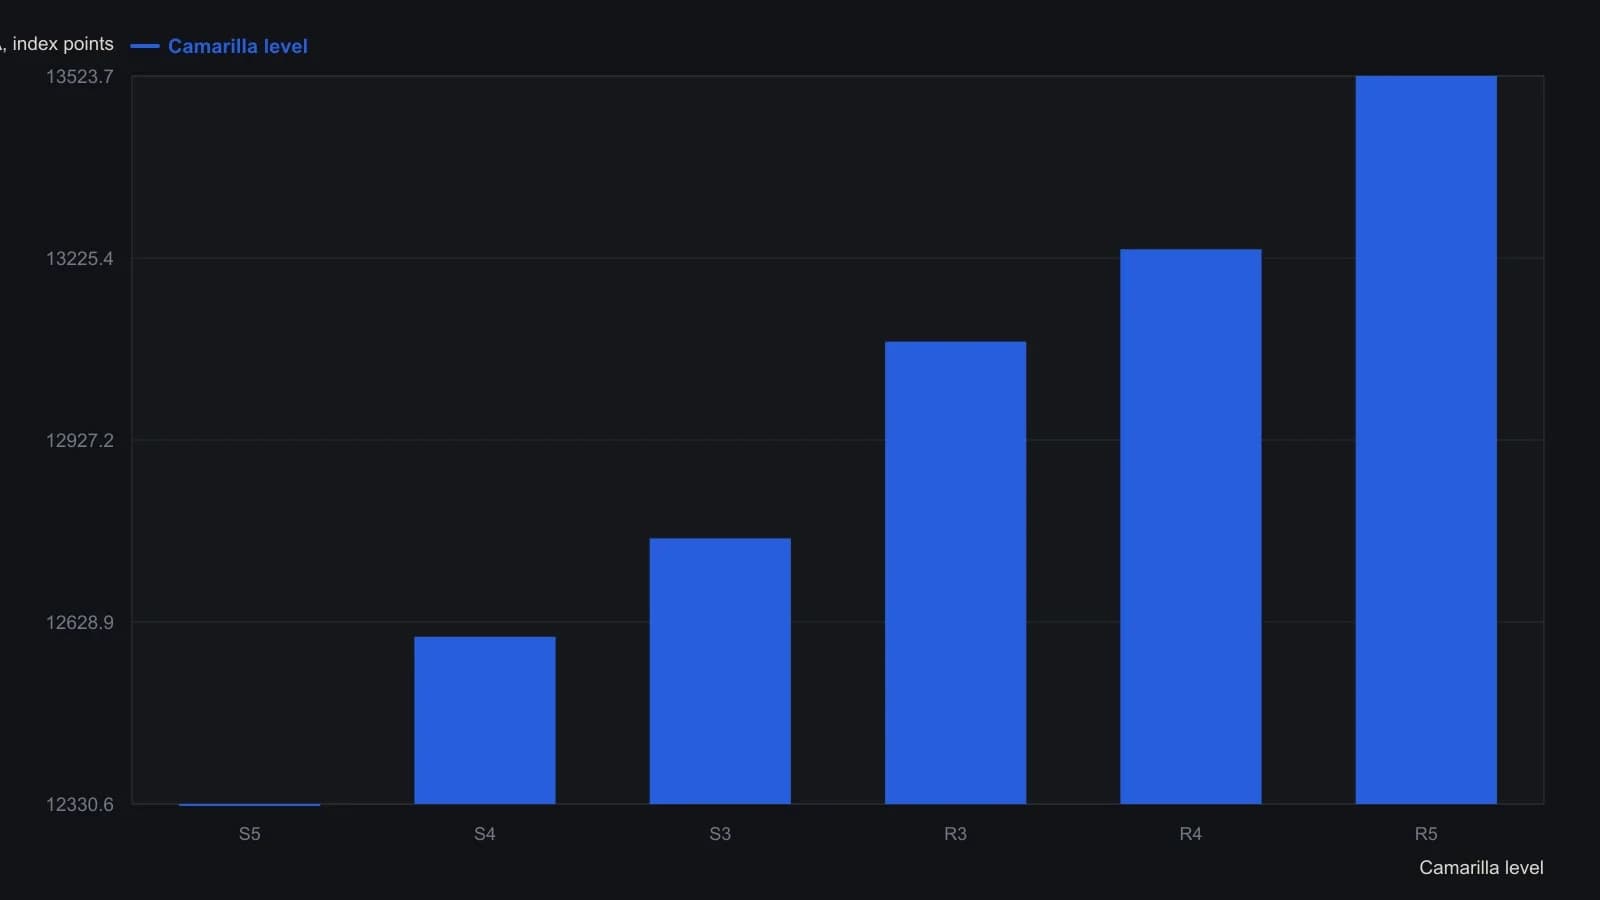
Inputs are the prior 25-session high 13297.11, low 12710.56, and close 12927.17 from 19 March–23 April 2012. The window was chosen with Wilder’s Delta Phenomenon so that S3 and R3 would fall inside the next month’s hitting range.
Keeping S3 and R3 inside the hitting range
Choosing a time frame so that S3 and R3 still fall inside the market's hitting range is presented as necessary. An arbitrary horizon can omit one of those levels and change the trade outcome.
Worked examples apply the same Camarilla map on 25-day, 15-day, 19-day, and 3-day windows. One look-ahead window covers 4 to 28 September 2012 on the DJIA and S&P 500.
Leaving the range plan with an Elliott wave count
The archive presents Camarilla levels as better suited to range conditions than to runaway breakouts. Breakouts are more often handled with an Elliott wave count.
Editorial: once price clears S4 or R4, the range-fade hypothesis is no longer the working plan. An Elliott wave count of impulsive and corrective swings is the archive's way to decide whether that breakout is still valid or should be exited. That is the moment a Camarilla range trade is abandoned, not a reason to keep fading the inner band.
All readings on this track · 38 readings
- 1988Constructing action-reaction lines from two pivots
- 1988Constructing intradaily point-and-figure boxes and pivot ladders
- 1991Constructing layered support and resistance from swings, pivots, and retracements
- 1994Three locks on a day-session order, then a staged exit
- 1994Building a five-level daily pivot grid
- 1996Constructing daily pivot points from session prices
- 1996Higher time frame balance points as a trend and band filter
- 1998Cup-with-handle construction rules
- 2000Pivot levels as a daily trade hypothesis
- 2001Construct a same-session polarity card around the daily pivot
- 2001Trading inside the cup-with-handle before the breakout
- 2005A lower-low rebound as one entry, abstention, and stop routine
- 2006Constructing session pivot maps from the prior high, low, and close
- 2006Constructing a pivot grid for stops and buy-stops
- 2006Monoparametric automatic trendline construction
- 2008Write the exit before the entry
- 2010Dynamic-pivot range grids for trend bias
- 2010Reverse-entry exits for pairs, pivots and support
- 2011Sequencing pairs, futures pivots, and implied volatility
- 2013Constructing Camarilla levels from prior range
- 2013Camarilla levels as a multi-timeframe map of reversion and breakout
- 2013Constructing a camarilla-grid from a completed lookback range
- 2013Constructing daily pivot support and resistance rungs
- 2014Constructing daily pivot levels from prior-session OHLC
- 2014Next-session pivot support and resistance from daily bars
- 2014Constructing session pivot rails from the prior-day range
- 2014Evaluating moving-average, pivot, and support-resistance filters
- 2016Stage a Trailing stop toward a planned target
- 2016Smoothed RSI and full-cut pivots for option-income exits
- 2017Constructing a weekly seasonality pivot scaffold
- 2017Seasonality and pivot points as scenario maps, not forecasts
- 2018Wave pivots, strength filters, and option premium
- 2018Constructing Fibonacci and daily pivot support maps
- 2018Building a daily pivot lattice with Fibonacci rails
- 2019Prior-session pivot channels for same-day entries
- 2019Constructing intraday pivot channels from prior-session levels
- 2020Variable-strength pivot highs as falsifiable entry filters
- 2020A high-volume-pivot long after a multi-week decline