2006issue C061-3
Constructing a pivot grid for stops and buy-stops
The five-level pivot-point grid is built from the prior high, low, and close so the same fulcrum that names support-resistance also names a stop-loss rail and a buy-stop. Editorial: those rails are usable only when their width matches the risk budget already intended.
- The objective construction averages high, low, and close into a pivot-point, then names first and second support-resistance rails from that pivot plus the session high and low.
- The central pivot sits midway between second-support and second-resistance and is treated as a fulcrum; a cross of that level is read as a directional test.
- A protective stop-loss is parked one price unit under second-support, and a buy-stop is parked one price unit above second-resistance, so contact with a rail is not treated as the event.
- Editorial: the finished grid is a construction test only if the outer rails also fit the risk budget already intended, because second-support can sit much tighter than a conventional stop.
The construction test
The historical workflow builds a five-level support-resistance grid from a calculated pivot-point. Editorial: treat that grid as a construction test. The same arithmetic that names the fulcrum must also produce a stop-loss rail and a breakout buy-stop, and those rails are usable only if their width matches the risk budget already intended.
A cross of the central pivot is used as a directional test. Trade above it is read as bullish structure, and trade below it is read as bearish structure.
How the five levels are named
The objective construction averages high, low, and close to form the pivot-point. First support is twice that pivot minus the high. Second-support is the pivot minus the high plus the low. First resistance is twice the pivot minus the low. Second-resistance is the pivot plus the high minus the low.
On this grid the central pivot sits midway between second-support and second-resistance, which is why it is treated as a fulcrum.
The open is not an input to the five-level construction, so instruments that publish only a closing print cannot populate the grid.
AAPL five-level pivot grid, 6 January 2006
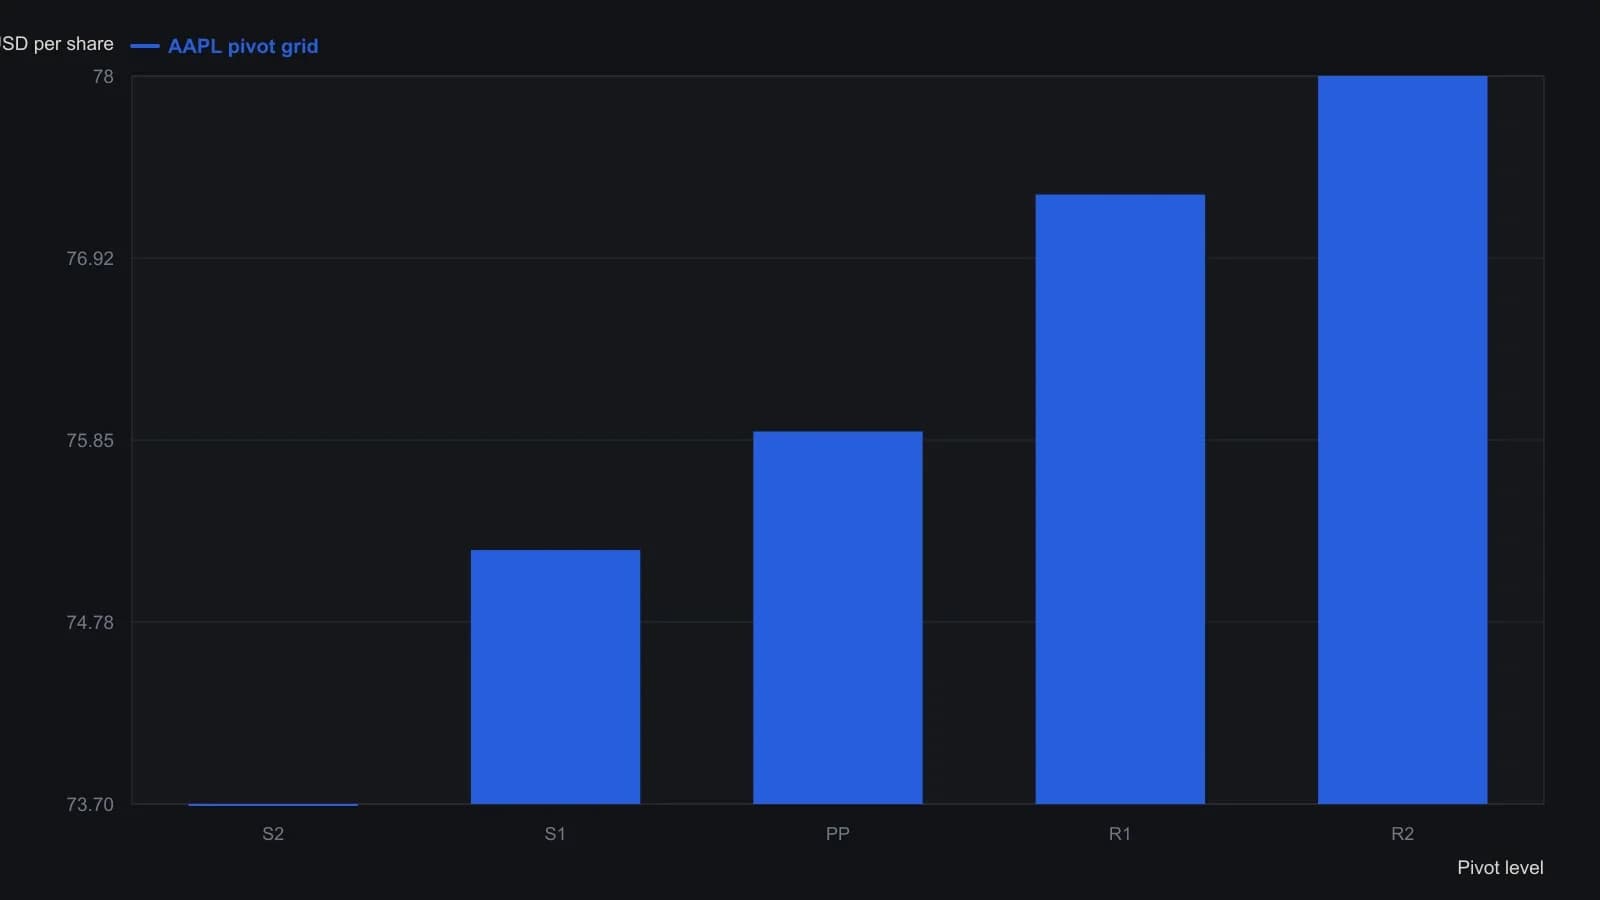
Standard five-level construction: PP=(H+L+C)/3, S1=2×PP−H, S2=PP−H+L, R1=2×PP−L, R2=PP+H−L. The open is not in the equation. The sheet’s displayed one-decimal values are used as printed; the author then offsets the outer rails by one dollar when placing the stop and the buy-stop.
Stops parked on the outer rails
An opening print above the pivot is framed as a continuation cue for a market long, with a protective stop-loss one price unit under second-support so contact with that rail is not automatically an exit.
A buy-stop one price unit above second-resistance is constructed so entry waits for a break of that ceiling. The extra unit is meant to reduce fills that reverse at the line. That unit offset is not treated as fixed across all price levels.
Variants and a different kind of pivot
Variant constructions include averaging high, low, close, and open; replacing the prior close with the current open; and adding third support and resistance. A wide high-low session can stretch the outer band 20-30 percent from the pivot.
The same swing-extremum idea appears under several labels: high and low pivots, isolated highs and lows, and high points and low points. Those labels are distinct from the formula grid.
All readings on this track · 38 readings
- 1988Constructing action-reaction lines from two pivots
- 1988Constructing intradaily point-and-figure boxes and pivot ladders
- 1991Constructing layered support and resistance from swings, pivots, and retracements
- 1994Three locks on a day-session order, then a staged exit
- 1994Building a five-level daily pivot grid
- 1996Constructing daily pivot points from session prices
- 1996Higher time frame balance points as a trend and band filter
- 1998Cup-with-handle construction rules
- 2000Pivot levels as a daily trade hypothesis
- 2001Construct a same-session polarity card around the daily pivot
- 2001Trading inside the cup-with-handle before the breakout
- 2005A lower-low rebound as one entry, abstention, and stop routine
- 2006Constructing session pivot maps from the prior high, low, and close
- 2006Constructing a pivot grid for stops and buy-stops
- 2006Monoparametric automatic trendline construction
- 2008Write the exit before the entry
- 2010Dynamic-pivot range grids for trend bias
- 2010Reverse-entry exits for pairs, pivots and support
- 2011Sequencing pairs, futures pivots, and implied volatility
- 2013Constructing Camarilla levels from prior range
- 2013Camarilla levels as a multi-timeframe map of reversion and breakout
- 2013Constructing a camarilla-grid from a completed lookback range
- 2013Constructing daily pivot support and resistance rungs
- 2014Constructing daily pivot levels from prior-session OHLC
- 2014Next-session pivot support and resistance from daily bars
- 2014Constructing session pivot rails from the prior-day range
- 2014Evaluating moving-average, pivot, and support-resistance filters
- 2016Stage a Trailing stop toward a planned target
- 2016Smoothed RSI and full-cut pivots for option-income exits
- 2017Constructing a weekly seasonality pivot scaffold
- 2017Seasonality and pivot points as scenario maps, not forecasts
- 2018Wave pivots, strength filters, and option premium
- 2018Constructing Fibonacci and daily pivot support maps
- 2018Building a daily pivot lattice with Fibonacci rails
- 2019Prior-session pivot channels for same-day entries
- 2019Constructing intraday pivot channels from prior-session levels
- 2020Variable-strength pivot highs as falsifiable entry filters
- 2020A high-volume-pivot long after a multi-week decline