2013issue C0625
Constructing daily pivot support and resistance rungs
Rebuild the next session's central pivot and level ladder from yesterday's high, low, and close so nearby support and resistance read as a mapped bumper grid rather than an unexplained overlay.
- A daily central pivot is the average of the prior session's high, low, and close, the three prior-session inputs used to rebuild the next session's map.
- Resistance 1 is twice the central pivot minus the prior session low, and support 1 is twice the central pivot minus the prior session high.
- The same inputs generate a level ladder of support bands 1, 2, and 3 and matching resistance bands, read as nearby bumper zones rather than standalone trade instructions.
- A bounce at a constructed pivot is a stronger entry or exit hypothesis only after a confluence check with other simple indicators.
Start from yesterday's high, low, and close
A daily central pivot is constructed by averaging the prior session's high, low, and close. That central pivot is the session midpoint built from those three prior-session inputs: yesterday's high, low, and close, the prints used to rebuild the daily ladder.
The constructed central pivot can be plotted on a daily bar chart as a visual reference for the session map.
Construct resistance 1, support 1, and the level ladder
The first resistance rung, resistance 1, is the first upside bumper, constructed as twice the central pivot minus the prior session low. The first support rung, support 1, is the first downside bumper, constructed as twice the central pivot minus the prior session high.
The same prior-session high, low, and close are used to generate support bands labeled 1, 2, and 3 and a matching set of resistance bands. That full set of bands around the central pivot is the level ladder.
Daily pivot ladder rebuilt from yesterday's high, low, and close
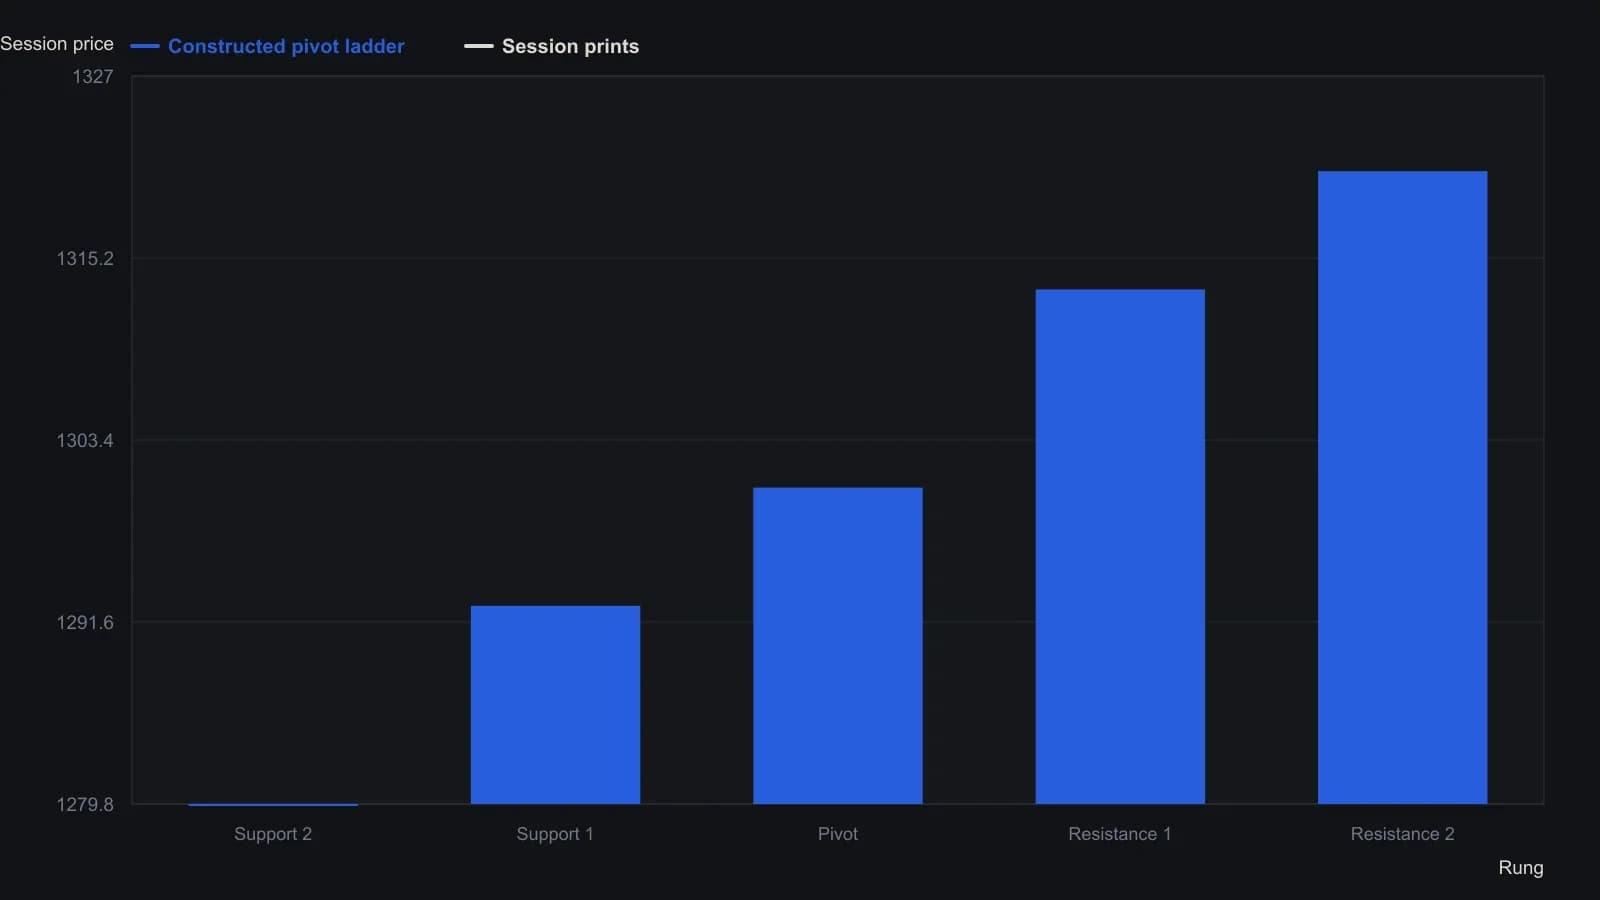
Pivot, resistance 1, and support 1 use the floor-trader formulas printed beside the figure. Resistance 2 and support 2 complete that same classic ladder as pivot plus or minus yesterday's 20.50-point range, matching where the unlabeled rungs sit on the chart.
Read rungs as bumper zones
Constructed pivot levels are treated as nearby support, resistance, or caution marks, not as standalone trade instructions. A reaction at a constructed pivot may be brief, so the level is framed as a temporary bumper rather than a guaranteed reversal.
Each rung is therefore a bumper zone: a nearby support or resistance mark where price may stall or bounce briefly, treated as a caution area rather than a guaranteed turn.
Confirm a bounce with a confluence check
A bounce at a constructed pivot is treated as a stronger entry or exit hypothesis only when other simple indicators align with that level at the same time. That pairing is a confluence check: using other simple indicators together with a constructed pivot level before treating a reaction as an entry or exit hypothesis.
All readings on this track · 38 readings
- 1988Constructing action-reaction lines from two pivots
- 1988Constructing intradaily point-and-figure boxes and pivot ladders
- 1991Constructing layered support and resistance from swings, pivots, and retracements
- 1994Three locks on a day-session order, then a staged exit
- 1994Building a five-level daily pivot grid
- 1996Constructing daily pivot points from session prices
- 1996Higher time frame balance points as a trend and band filter
- 1998Cup-with-handle construction rules
- 2000Pivot levels as a daily trade hypothesis
- 2001Construct a same-session polarity card around the daily pivot
- 2001Trading inside the cup-with-handle before the breakout
- 2005A lower-low rebound as one entry, abstention, and stop routine
- 2006Constructing session pivot maps from the prior high, low, and close
- 2006Constructing a pivot grid for stops and buy-stops
- 2006Monoparametric automatic trendline construction
- 2008Write the exit before the entry
- 2010Dynamic-pivot range grids for trend bias
- 2010Reverse-entry exits for pairs, pivots and support
- 2011Sequencing pairs, futures pivots, and implied volatility
- 2013Constructing Camarilla levels from prior range
- 2013Camarilla levels as a multi-timeframe map of reversion and breakout
- 2013Constructing a camarilla-grid from a completed lookback range
- 2013Constructing daily pivot support and resistance rungs
- 2014Constructing daily pivot levels from prior-session OHLC
- 2014Next-session pivot support and resistance from daily bars
- 2014Constructing session pivot rails from the prior-day range
- 2014Evaluating moving-average, pivot, and support-resistance filters
- 2016Stage a Trailing stop toward a planned target
- 2016Smoothed RSI and full-cut pivots for option-income exits
- 2017Constructing a weekly seasonality pivot scaffold
- 2017Seasonality and pivot points as scenario maps, not forecasts
- 2018Wave pivots, strength filters, and option premium
- 2018Constructing Fibonacci and daily pivot support maps
- 2018Building a daily pivot lattice with Fibonacci rails
- 2019Prior-session pivot channels for same-day entries
- 2019Constructing intraday pivot channels from prior-session levels
- 2020Variable-strength pivot highs as falsifiable entry filters
- 2020A high-volume-pivot long after a multi-week decline