1994issue C081-5
Building a five-level daily pivot grid
A daily pivot is the mean of the prior session high, low, and settlement and is the input to four further levels: two resistances above the pivot and two supports below it. The first pivot break is the directional cue. Later levels serve as objectives and as places to cancel or relocate a trailing stop.
- A daily pivot is the mean of the prior session high, low, and settlement, and that single value is the input to the four remaining level formulas.
- The completed grid places two resistance levels above the pivot and two support levels below it.
- Directional use buys when price first breaks the pivot in an advance and sells when price first breaks the pivot in a decline; later same-session rebreaks are given less weight.
- After a grid level is broken, its role reverses and the trailing stop is relocated just beyond the broken level.
From one session to a five-level grid
A daily pivot is constructed as the mean of the previous session high, low, and settlement. That single value is an input to the four remaining level formulas.
The completed grid places two resistance levels above the pivot and two support levels below it.
Near levels and the outer grid
First resistance equals twice the pivot minus the prior low. First support equals twice the pivot minus the prior high. Those are the nearer expected reaction zones above and below the daily pivot.
The outer grid is the second resistance and second support pair, derived from the span between the first support and first resistance. Those outer levels are the expected reaction points farther from the center.
Five-level daily pivot grid from a 50-40-48 session
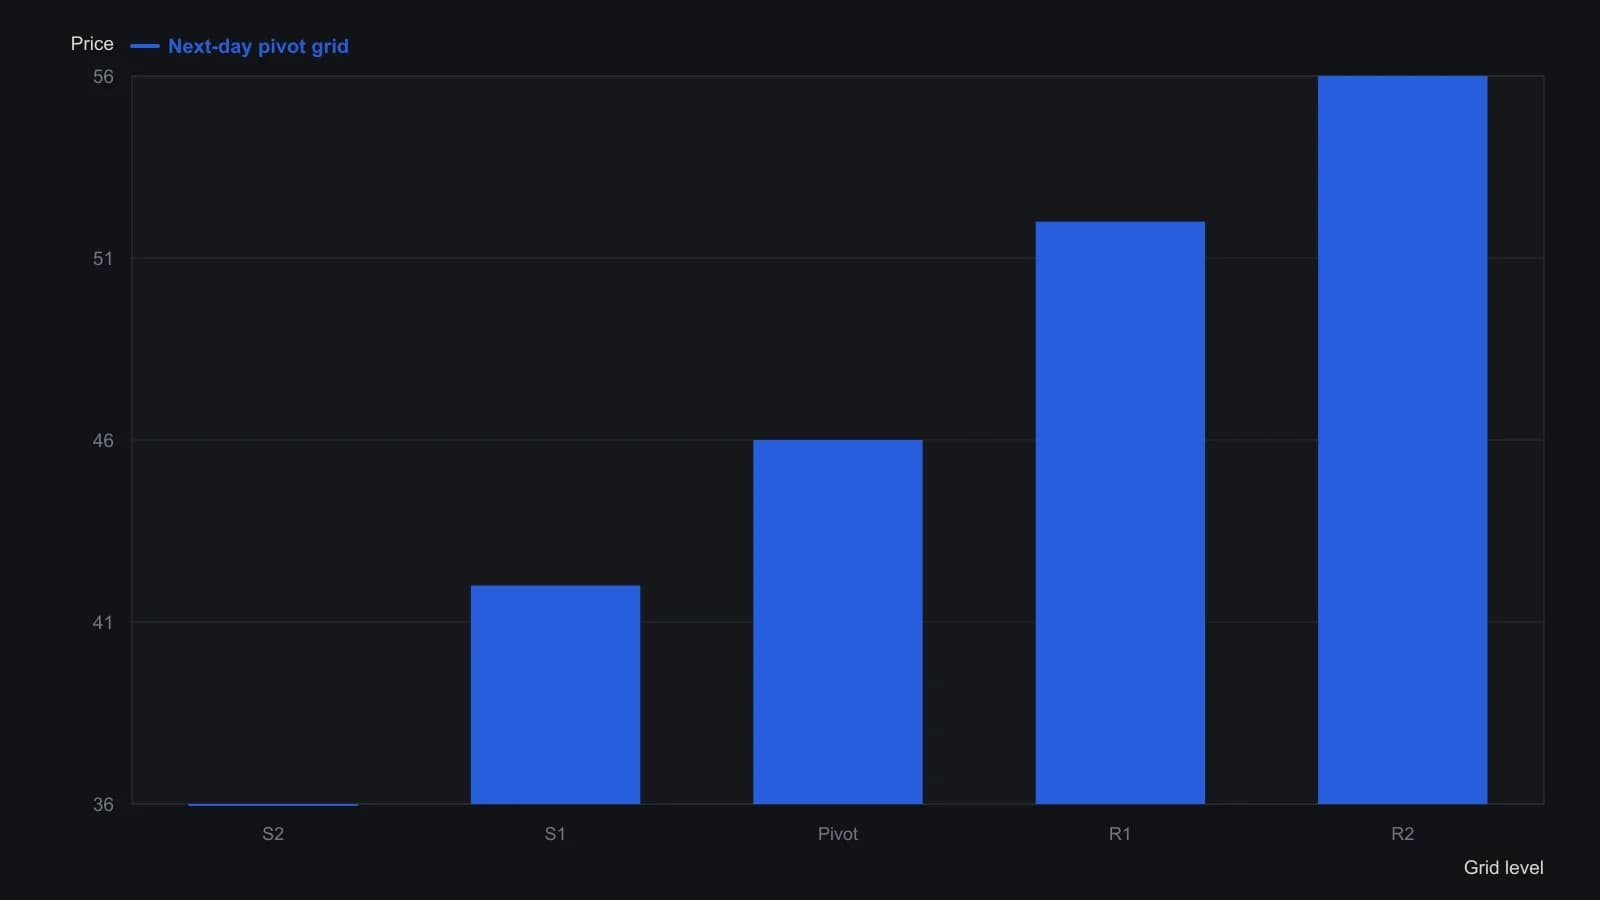
P=(H+L+C)/3, R1=2P−L, S1=2P−H, R2=(P−S1)+R1, S2=P−(R1−S1). Levels are built from one prior session only.
First violation of the pivot
Directional use of the grid is defined as buying when price first breaks the pivot in an advance and selling when price first breaks the pivot in a decline. Later same-session rebreaks of that same level are given less weight.
That earliest same-session break is the first violation.
Objectives, role reversal, and stop relocation
A long started at or just above the pivot treats first resistance as the initial objective. A trailing stop is canceled if that level holds and is moved just above it if the level is broken.
After a grid level is broken, former resistance is treated as later support and former support as later resistance. That level role reversal is paired with trailing stop relocation: the stop is moved just beyond the broken level.
Second resistance and second support are the outer expected reaction points. A break of second resistance is treated as a reason not to remain short, and a break of second support as a reason not to remain long.
Stop distance is set before entry
Stop distance is chosen before entry. Illustrated allowances are six ticks in the S&P 500, three ticks in Treasury bonds, and eight ticks in currencies.
All readings on this track · 38 readings
- 1988Constructing action-reaction lines from two pivots
- 1988Constructing intradaily point-and-figure boxes and pivot ladders
- 1991Constructing layered support and resistance from swings, pivots, and retracements
- 1994Three locks on a day-session order, then a staged exit
- 1994Building a five-level daily pivot grid
- 1996Constructing daily pivot points from session prices
- 1996Higher time frame balance points as a trend and band filter
- 1998Cup-with-handle construction rules
- 2000Pivot levels as a daily trade hypothesis
- 2001Construct a same-session polarity card around the daily pivot
- 2001Trading inside the cup-with-handle before the breakout
- 2005A lower-low rebound as one entry, abstention, and stop routine
- 2006Constructing session pivot maps from the prior high, low, and close
- 2006Constructing a pivot grid for stops and buy-stops
- 2006Monoparametric automatic trendline construction
- 2008Write the exit before the entry
- 2010Dynamic-pivot range grids for trend bias
- 2010Reverse-entry exits for pairs, pivots and support
- 2011Sequencing pairs, futures pivots, and implied volatility
- 2013Constructing Camarilla levels from prior range
- 2013Camarilla levels as a multi-timeframe map of reversion and breakout
- 2013Constructing a camarilla-grid from a completed lookback range
- 2013Constructing daily pivot support and resistance rungs
- 2014Constructing daily pivot levels from prior-session OHLC
- 2014Next-session pivot support and resistance from daily bars
- 2014Constructing session pivot rails from the prior-day range
- 2014Evaluating moving-average, pivot, and support-resistance filters
- 2016Stage a Trailing stop toward a planned target
- 2016Smoothed RSI and full-cut pivots for option-income exits
- 2017Constructing a weekly seasonality pivot scaffold
- 2017Seasonality and pivot points as scenario maps, not forecasts
- 2018Wave pivots, strength filters, and option premium
- 2018Constructing Fibonacci and daily pivot support maps
- 2018Building a daily pivot lattice with Fibonacci rails
- 2019Prior-session pivot channels for same-day entries
- 2019Constructing intraday pivot channels from prior-session levels
- 2020Variable-strength pivot highs as falsifiable entry filters
- 2020A high-volume-pivot long after a multi-week decline