1996issue C111-5
Higher time frame balance points as a trend and band filter
The next higher bar interval sets a typical-price balance point and a pair of support and resistance bands for the chart being traded. A stepped average of recent higher-period balance points is then read as a directional permission line for bounces at those bands.
- The next higher bar interval defines the tradable trend and the main support and resistance bands for the interval being traded.
- A fixed balance point is the higher-period high, low, and close summed and divided by three, held as one horizontal line, with resistance and support bands at 50 percent and 61.8 percent of the prior higher-period range.
- Averaging the last five weekly fixed balance points and plotting that value across the next week is used as a directional permission line, not as an entry trigger.
- A dynamic balance point updates on every lower-period close, and short sales are withheld when the dynamic daily step remains below the dynamic daily balance point.
The next higher interval sets the map
A higher time frame is used to define the tradable trend and the main support and resistance bands for the time frame being traded. Daily wheat analysis takes its trend and bands from the weekly chart, and 60-minute analysis takes them from the daily chart.
The same high-low-close calculations that define trend and bands on one interval pair are treated as reusable on any other pair, because the lower period is treated as a scaled model of the higher period. That pairing is the multiple-time-frames rule in this workflow: the next higher bar interval defines trend and bands for the interval being traded.
Fixed balance point and bands
The fixed balance point is the higher-period high, low, and close summed and divided by three, then held as one horizontal line across the next lower period. That typical-price balance point is the pivot point: it is computed from a higher time period high, low, and close, then plotted forward as the reference level for the next lower-period bars.
The resistance band runs from 50 percent to 61.8 percent of the prior higher-period range above the balance point, and the support band is the matching pair below it. Those two bands are the support and resistance pair around the balance point.
A Friday close above the next week's balance point is used to anticipate that the resistance band is reached first. A close below is used to anticipate the support band.
Stepped balance points as permission
The longer-term tradable trend is read from weekly balance-point steps made by averaging the last five weekly fixed balance points and plotting that value across the next week. That stepped average of recent higher-period balance points is the trend filter: a directional permission line rather than an entry trigger.
When daily prices sit above rising weekly steps, retracements to the support band are treated as buys in the tradable trend. When the steps trend down, rallies are treated as sells.
Weekly balance-point steps on daily US T-bonds
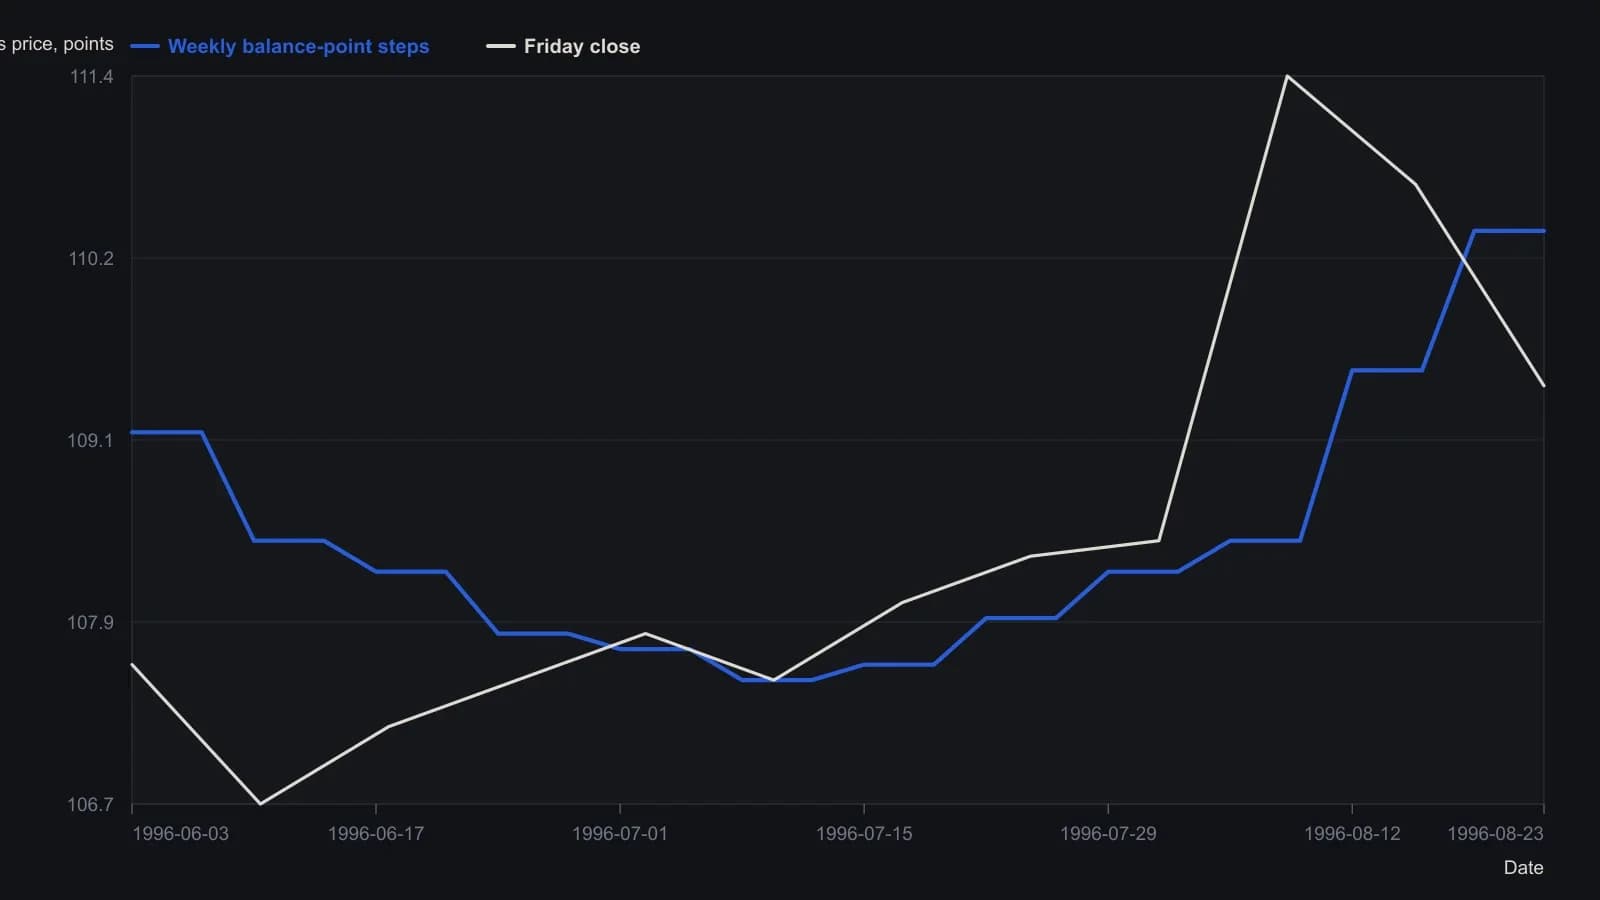
Digitized from the raster to 0.1 point. The contract is quoted in 32nds on the title bar (last print 109-12). Each step is the source’s five-week average of weekly (H+L+C)/3, held Monday–Friday. Hatched support and resistance bands were left as context and not turned into a series.
A moving map on the lower chart
A dynamic balance point is recalculated on every lower-period close with a lookback equal to the number of bars in one higher-period session, such as eight 50-minute bars in a 400-minute bond day. The same typical-price calculation is updated on every lower-period bar so the map can move during the session.
When the dynamic daily step remains below the dynamic daily balance point, short sales are withheld even if price dips under both lines, as shown on nine-minute equity-index and 45-minute wheat examples.
All readings on this track · 38 readings
- 1988Constructing action-reaction lines from two pivots
- 1988Constructing intradaily point-and-figure boxes and pivot ladders
- 1991Constructing layered support and resistance from swings, pivots, and retracements
- 1994Three locks on a day-session order, then a staged exit
- 1994Building a five-level daily pivot grid
- 1996Constructing daily pivot points from session prices
- 1996Higher time frame balance points as a trend and band filter
- 1998Cup-with-handle construction rules
- 2000Pivot levels as a daily trade hypothesis
- 2001Construct a same-session polarity card around the daily pivot
- 2001Trading inside the cup-with-handle before the breakout
- 2005A lower-low rebound as one entry, abstention, and stop routine
- 2006Constructing session pivot maps from the prior high, low, and close
- 2006Constructing a pivot grid for stops and buy-stops
- 2006Monoparametric automatic trendline construction
- 2008Write the exit before the entry
- 2010Dynamic-pivot range grids for trend bias
- 2010Reverse-entry exits for pairs, pivots and support
- 2011Sequencing pairs, futures pivots, and implied volatility
- 2013Constructing Camarilla levels from prior range
- 2013Camarilla levels as a multi-timeframe map of reversion and breakout
- 2013Constructing a camarilla-grid from a completed lookback range
- 2013Constructing daily pivot support and resistance rungs
- 2014Constructing daily pivot levels from prior-session OHLC
- 2014Next-session pivot support and resistance from daily bars
- 2014Constructing session pivot rails from the prior-day range
- 2014Evaluating moving-average, pivot, and support-resistance filters
- 2016Stage a Trailing stop toward a planned target
- 2016Smoothed RSI and full-cut pivots for option-income exits
- 2017Constructing a weekly seasonality pivot scaffold
- 2017Seasonality and pivot points as scenario maps, not forecasts
- 2018Wave pivots, strength filters, and option premium
- 2018Constructing Fibonacci and daily pivot support maps
- 2018Building a daily pivot lattice with Fibonacci rails
- 2019Prior-session pivot channels for same-day entries
- 2019Constructing intraday pivot channels from prior-session levels
- 2020Variable-strength pivot highs as falsifiable entry filters
- 2020A high-volume-pivot long after a multi-week decline