2018issue C1248-58
Building a daily pivot lattice with Fibonacci rails
One completed day's high, low, and close can be rebuilt into a session support and resistance grid. Mid-levels fill the gaps between classic pivot prices, and Fibonacci retracements of an identified swing can sit on the same chart as a second ruler.
- The central pivot is the mean of the prior session high, low, and close, and it is the origin for the rest of the daily grid.
- Mid-levels are halfway prices between neighboring classic levels, and the completed overlay also includes the prior session high and low.
- A session-reset locks yesterday's high, low, and close, then builds the current day's grid once while today's extremes keep updating.
- Fibonacci retracements, projections, and time lines from identified swings can share the chart with the daily pivot and mid-level grid.
From one completed session
The modified daily-pivot construction keeps the classic floor-trader family and adds mid-levels between adjacent support and resistance prices, plus the prior session high and low.
The central pivot equals the mean of the prior session high, low, and close. A pivot point is that session reference price, used to project a family of support and resistance prices for the current session.
On this grid, support and resistance means a horizontal price where the constructed pivot family, mid-levels, or prior-day extremes are expected to be tested.
Classic levels and mid-levels
First resistance is twice the pivot minus the prior low. First support is twice the pivot minus the prior high.
The second pair adds or subtracts the prior-session-range from the pivot. That prior-session-range is the difference between yesterday's high and low, reused as the step size for second-tier and third-tier projections.
Each mid-level is the halfway price between two neighboring classic levels, equivalently the average of that pair, and is treated as an extra support or resistance line.
Microsoft daily SvePivot lattice, 18 October 2018
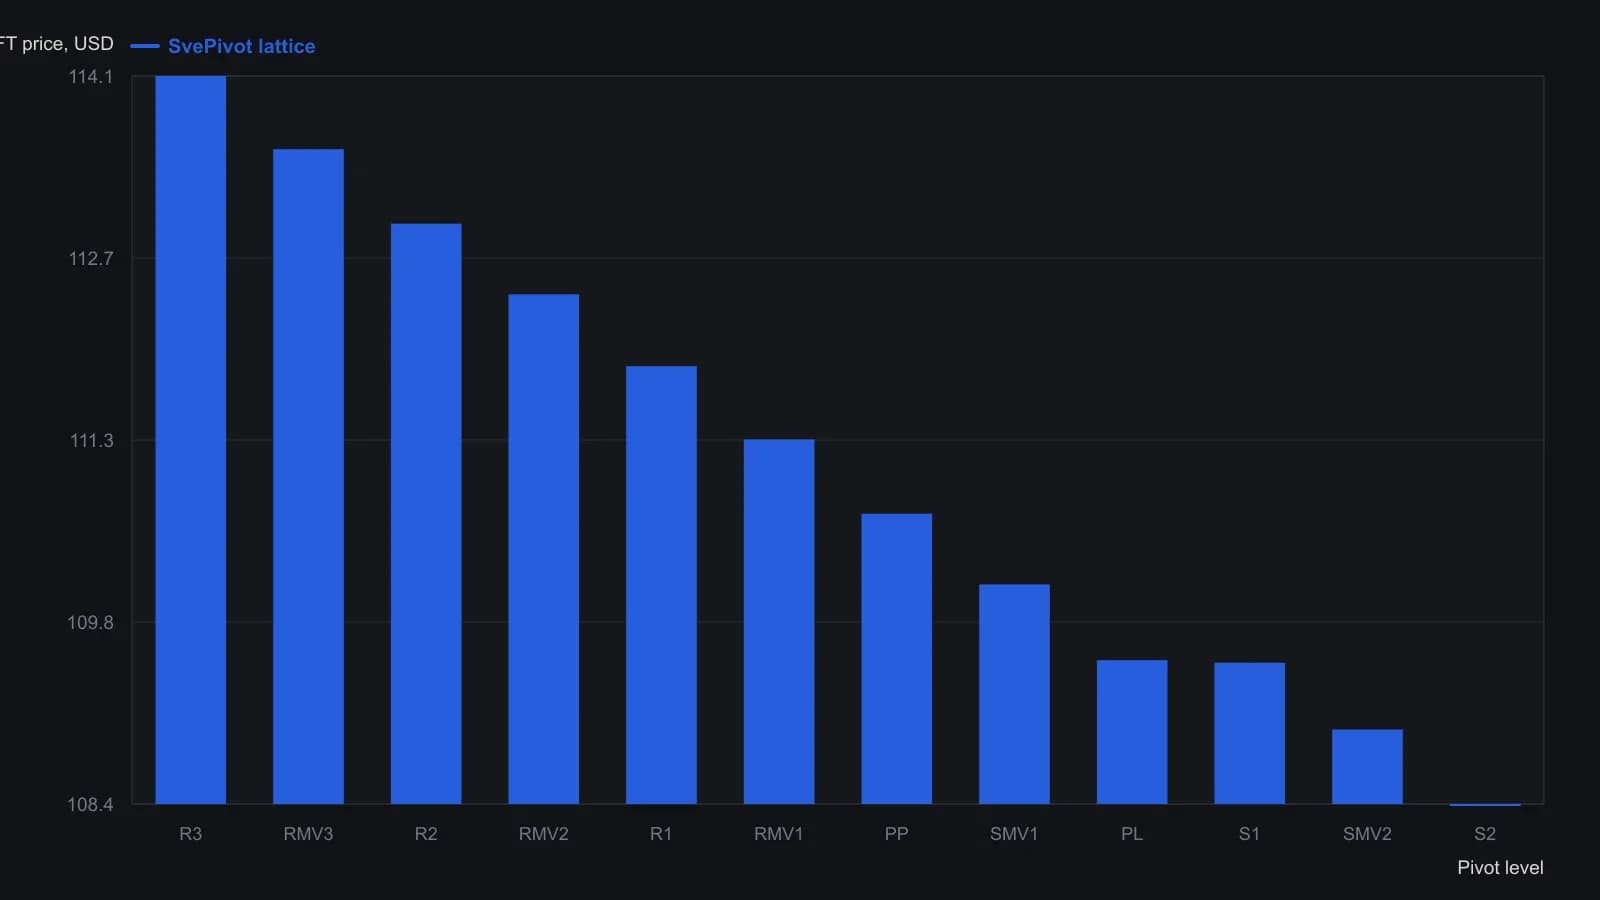
Lattice is computed from the prior session high, low and close and held flat through the cash session; Microsoft last printed 108.26 at 15:35, beneath S2.
The completed overlay
One complete overlay draws 15 horizontal references. The 13 derived prices stay ranked from the third resistance at the top to the third support at the bottom, while the prior high and low can sit anywhere in that stack.
Session-reset and lower-timeframe charts
Recalculation is session-based. A session-reset is the bar-to-bar change of trading day that freezes yesterday's extremes and close and rebuilds the entire grid once for the new session.
Those locked values generate the current day's grid while today's extremes continue to update.
Daily high, low, and close can be taken from a compressed higher timeframe and then synchronized back onto an intraday chart so the same session grid appears on lower-timeframe bars.
Fibonacci references on the same chart
Fibonacci retracements, projections, and time lines drawn from identified price swings are presented as a companion construction that can share the chart with the daily pivot and mid-level support-resistance grid.
A Fibonacci retracement is a measured fraction of a completed price swing, drawn as a horizontal or time reference that can be compared with the daily pivot rails on the same chart.
The same formulas can be published as a next-session report that lists the main support and resistance prices separately from the in-between mid-levels.
All readings on this track · 38 readings
- 1988Constructing action-reaction lines from two pivots
- 1988Constructing intradaily point-and-figure boxes and pivot ladders
- 1991Constructing layered support and resistance from swings, pivots, and retracements
- 1994Three locks on a day-session order, then a staged exit
- 1994Building a five-level daily pivot grid
- 1996Constructing daily pivot points from session prices
- 1996Higher time frame balance points as a trend and band filter
- 1998Cup-with-handle construction rules
- 2000Pivot levels as a daily trade hypothesis
- 2001Construct a same-session polarity card around the daily pivot
- 2001Trading inside the cup-with-handle before the breakout
- 2005A lower-low rebound as one entry, abstention, and stop routine
- 2006Constructing session pivot maps from the prior high, low, and close
- 2006Constructing a pivot grid for stops and buy-stops
- 2006Monoparametric automatic trendline construction
- 2008Write the exit before the entry
- 2010Dynamic-pivot range grids for trend bias
- 2010Reverse-entry exits for pairs, pivots and support
- 2011Sequencing pairs, futures pivots, and implied volatility
- 2013Constructing Camarilla levels from prior range
- 2013Camarilla levels as a multi-timeframe map of reversion and breakout
- 2013Constructing a camarilla-grid from a completed lookback range
- 2013Constructing daily pivot support and resistance rungs
- 2014Constructing daily pivot levels from prior-session OHLC
- 2014Next-session pivot support and resistance from daily bars
- 2014Constructing session pivot rails from the prior-day range
- 2014Evaluating moving-average, pivot, and support-resistance filters
- 2016Stage a Trailing stop toward a planned target
- 2016Smoothed RSI and full-cut pivots for option-income exits
- 2017Constructing a weekly seasonality pivot scaffold
- 2017Seasonality and pivot points as scenario maps, not forecasts
- 2018Wave pivots, strength filters, and option premium
- 2018Constructing Fibonacci and daily pivot support maps
- 2018Building a daily pivot lattice with Fibonacci rails
- 2019Prior-session pivot channels for same-day entries
- 2019Constructing intraday pivot channels from prior-session levels
- 2020Variable-strength pivot highs as falsifiable entry filters
- 2020A high-volume-pivot long after a multi-week decline