2008issue C041-3
Write the exit before the entry
The archive marks covers with nearby support and resistance, measured pattern objectives, Fibonacci extensions, a floor-trader pivot ladder, and a parallel price channel. Editorial reading: treat a tight cluster of those projections as one named cover zone written before the entry.
- Oscillator overbought and oversold readings are timing cues and do not, by themselves, mark a specific chart price range for the cover.
- Candidate exits come from prior highs and lows, confirmed pattern objectives, Fibonacci extension ratios, the pivot ladder, and a parallel price channel.
- A single extension level is treated as an arbitrary stall point; a tight cluster of overlapping projections is offered as a narrower exit band.
- Editorial reading: name that band as the cover zone before entry, and resize it when structure changes rather than using a fixed dollar or point objective.
Timing is not an exit price
Oscillator overbought and oversold readings are described as timing cues that do not, by themselves, mark a specific chart price range at which to exit. The archive instead points to prices already on the chart: nearby support and resistance, measured pattern objectives, Fibonacci extensions from a completed swing, a floor-trader pivot ladder, and a parallel price channel.
Nearby structure and measured moves
Nearby support and resistance used as exit targets are identified as prior short-, medium-, and long-horizon highs and lows. On an intraday chart they also include the open, the close, and gap extremes.
Measured-move targets are described as changing with each pattern's size and length. Named formations include rectangles, triangles, wedges, pennants, flags, double tops, and double bottoms, each measured after confirmation.
Extensions from a completed swing
Fibonacci retracements are ratios taken from a completed price swing. They are presented as the usual pullback-entry tool, while extension ratios of 138 percent, 150 percent, 161.8 percent, and 200 percent are presented as candidate stall or reversal zones.
Any single extension level is treated as a somewhat arbitrary stall point. A tight cluster of overlapping projections is offered as a narrower exit band.
A pivot ladder on more than one frame
Floor-trader pivots are specified as the pivot average plus resistance steps R1, R2, and R3 and support steps S1, S2, and S3. Daily pivots are described as a session-timing device, and weekly and monthly pivots are described as the same ladder applied on higher time frames.
A parallel channel as a guideline
A price channel used for projected covers is drawn as two parallel trendlines through two recent highs and two recent lows. The lines frame a band of support and resistance as a guideline for covering or reversing, not a guaranteed reversal.
RIMM daily Fibonacci cover ladder
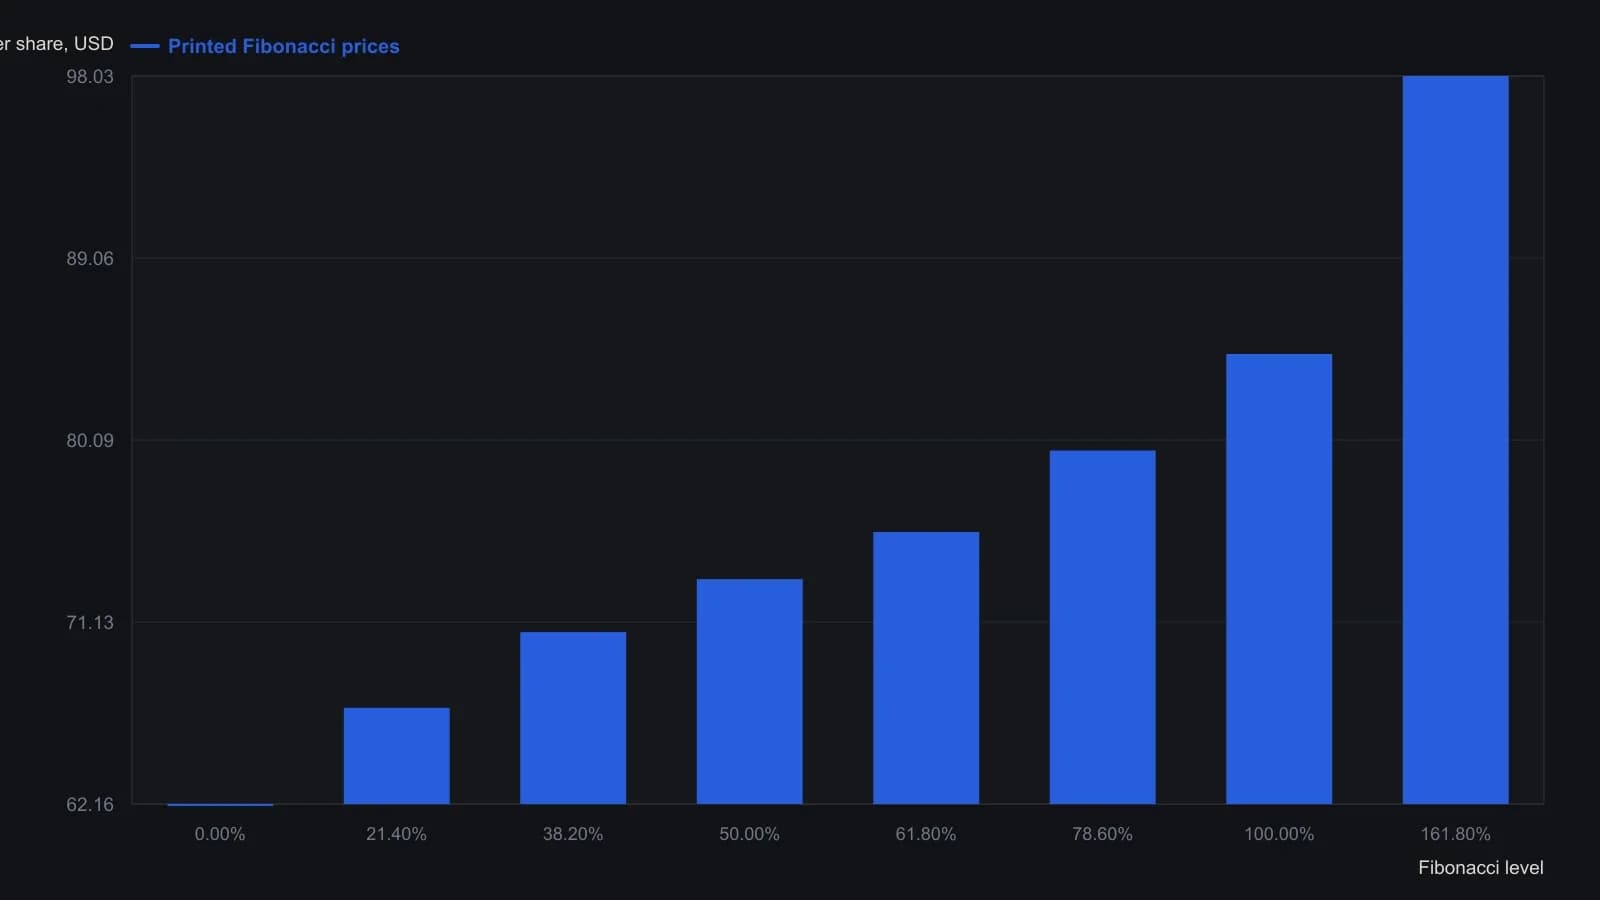
The source anchored 0 percent at 62.16 and 100 percent at 84.33. The 21.4, 38.2, 50, 61.8 and 78.6 percent rungs are retracements of that same swing; 161.8 percent is the only extension printed.
Name the cover before the entry
Editorial reading: write the exit before the entry. Convert the extension cluster, the pivot step that overlaps it, and the nearer channel line into one named cover zone. Profit-taking then becomes a falsifiable rule: if price reaches the band, the planned cover is due. If the projections do not overlap, there is no named zone yet and the hypothesis is not complete. The archive offers the cluster as a narrower exit band. The named zone is an editorial framing, not an archive rule.
Resize when the structure changes
Structure-based targets are contrasted with fixed dollar or point objectives. They are described as quantities that should be resized when conditions change, so covers are not taken too early or too late and stops are not left at an outdated distance.
Editorial reading: when the swing, the pivot period, or the channel is no longer the structure in force, rebuild the cover zone from the new projections rather than leaving a cover or a stop at an outdated distance.
All readings on this track · 38 readings
- 1988Constructing action-reaction lines from two pivots
- 1988Constructing intradaily point-and-figure boxes and pivot ladders
- 1991Constructing layered support and resistance from swings, pivots, and retracements
- 1994Three locks on a day-session order, then a staged exit
- 1994Building a five-level daily pivot grid
- 1996Constructing daily pivot points from session prices
- 1996Higher time frame balance points as a trend and band filter
- 1998Cup-with-handle construction rules
- 2000Pivot levels as a daily trade hypothesis
- 2001Construct a same-session polarity card around the daily pivot
- 2001Trading inside the cup-with-handle before the breakout
- 2005A lower-low rebound as one entry, abstention, and stop routine
- 2006Constructing session pivot maps from the prior high, low, and close
- 2006Constructing a pivot grid for stops and buy-stops
- 2006Monoparametric automatic trendline construction
- 2008Write the exit before the entry
- 2010Dynamic-pivot range grids for trend bias
- 2010Reverse-entry exits for pairs, pivots and support
- 2011Sequencing pairs, futures pivots, and implied volatility
- 2013Constructing Camarilla levels from prior range
- 2013Camarilla levels as a multi-timeframe map of reversion and breakout
- 2013Constructing a camarilla-grid from a completed lookback range
- 2013Constructing daily pivot support and resistance rungs
- 2014Constructing daily pivot levels from prior-session OHLC
- 2014Next-session pivot support and resistance from daily bars
- 2014Constructing session pivot rails from the prior-day range
- 2014Evaluating moving-average, pivot, and support-resistance filters
- 2016Stage a Trailing stop toward a planned target
- 2016Smoothed RSI and full-cut pivots for option-income exits
- 2017Constructing a weekly seasonality pivot scaffold
- 2017Seasonality and pivot points as scenario maps, not forecasts
- 2018Wave pivots, strength filters, and option premium
- 2018Constructing Fibonacci and daily pivot support maps
- 2018Building a daily pivot lattice with Fibonacci rails
- 2019Prior-session pivot channels for same-day entries
- 2019Constructing intraday pivot channels from prior-session levels
- 2020Variable-strength pivot highs as falsifiable entry filters
- 2020A high-volume-pivot long after a multi-week decline