1991issue C011-8
Constructing layered support and resistance from swings, pivots, and retracements
Support and resistance are constructed as areas of concentrated prior trading, then stacked from role reversals, demand lines, daily pivots, and retracement bands. When independent constructions confirm the same zone, that overlap is treated as the more accurate candidate area.
- Support and resistance are constructed as price areas of concentrated prior trading where buying or selling pressure is expected to reappear, and they can be drawn from the intraday horizon through multi-week positioning.
- In a strong advance, a former resistance print is redrawn as support after price has traded through it, and the uptrend map remains valid only while price holds support taken from an earlier high and then exceeds the latest high.
- When conventional chart levels cannot be drawn, a daily pivot and its first and second support and resistance projections are a fallback of limited value relative to chart-derived levels.
- Retracement support is constructed as an approximate band around 50 percent of the prior swing, and a candidate area is treated as more accurate when several independent constructions confirm the same zone.
Support and resistance as constructed areas
Support and resistance are constructed as price areas of concentrated prior trading where buying or selling pressure is expected to reappear. They can be drawn for every horizon from intraday to multi-week positioning.
Support is a price area of concentrated prior trading where buying pressure is expected to slow or halt a decline. Resistance is a price area of concentrated prior trading where selling pressure is expected to slow or halt an advance. Neither is drawn as a single print. Both are built as areas, then compared with other independent constructions on the same chart.
Role reversal in an advance
In a strong advance, the prior swing high is constructed as support for the next pullback. A former resistance print is redrawn as support after price has traded through it. That redrawing is role reversal: a broken resistance area becomes support, or a broken support area becomes resistance, once price has traded through it.
An uptrend map remains valid only while price holds the support taken from an earlier high and then exceeds the latest high, after which that latest high is redrawn as support. Failure of those successive supports interrupts the higher-high and higher-low sequence.
Minor horizontals and price clusters
Minor support and resistance are constructed by projecting horizontals through recent daily turning points and through later clusters of opens, highs, lows, and closes. A price cluster is a horizontal zone where several recent opens, highs, lows, or closes coincide and mark a candidate short-horizon barrier. More current turning points are treated as more likely to affect price.
Demand lines and later underside retests
A demand line is constructed by connecting successive higher lows. It is treated as rising support. A break below it is treated as evidence of trend change. The line is extended across the chart so later retests of its underside can be read as resistance.
December T-bond futures testing horizontal support and resistance
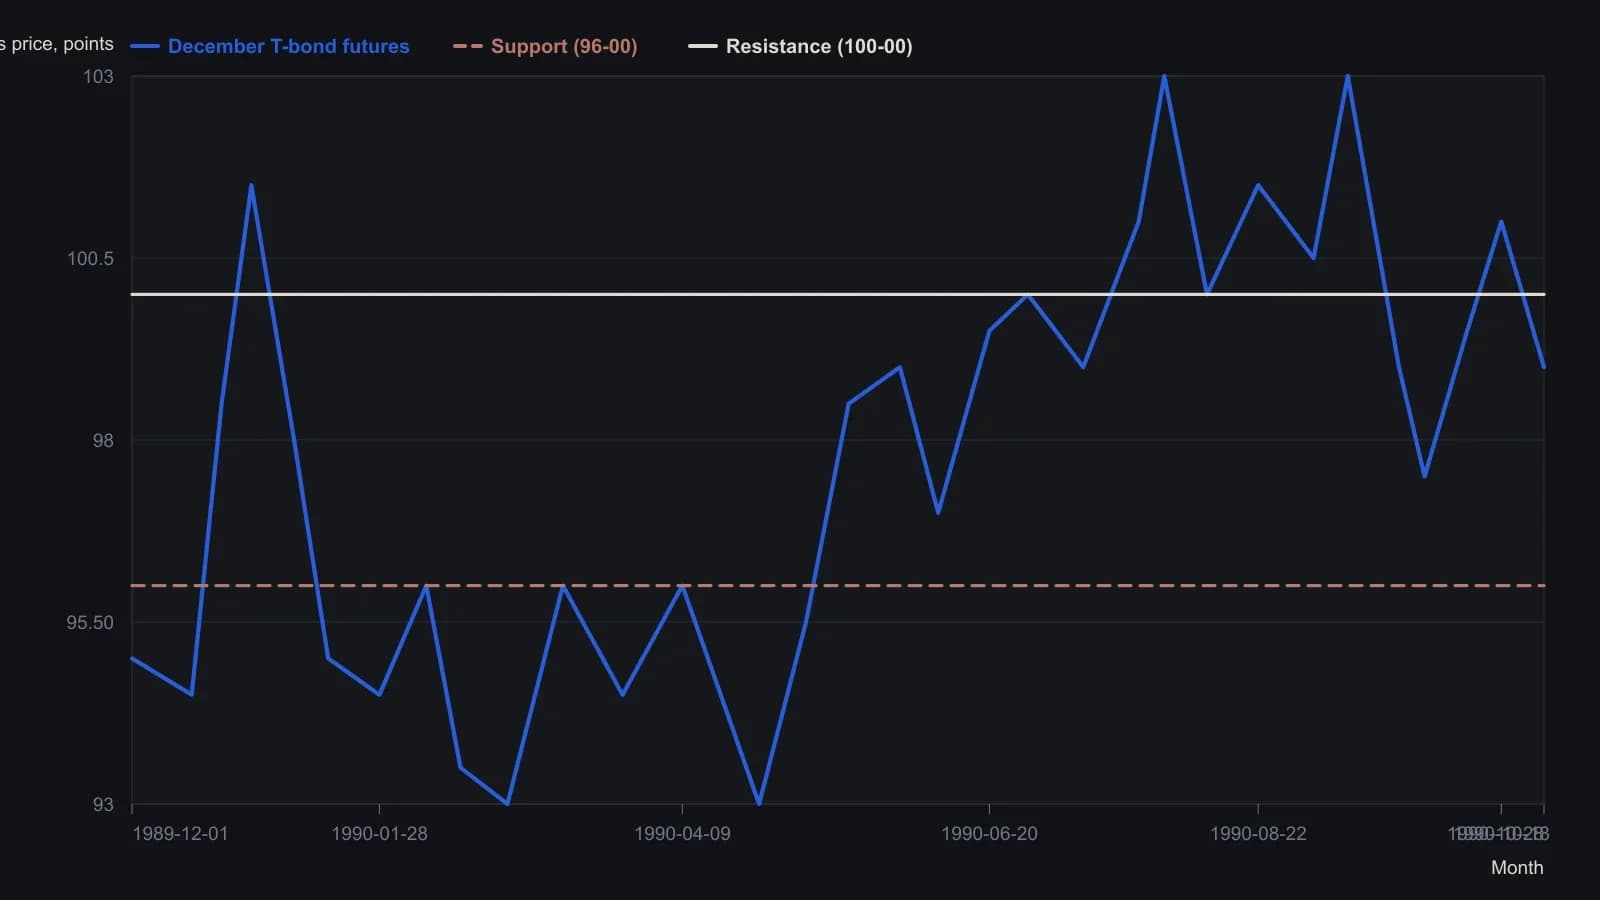
Read from the scanned daily-bar figure to the nearest half-point. Dates follow the printed month axis and are not session stamps. The dashed 96-00 line is support; the dashed 100-00 line is resistance.
Moving averages as extra areas
Widely watched 5-, 10-, 20-, and 50-day moving averages are constructed as additional support and resistance areas, with longer lookbacks treated as more significant. A valid penetration is defined as two consecutive sessions fully beyond the average, after which momentum is used as confirmation. The average is treated as a zone rather than an exact entry price.
Daily pivots as a fallback
When conventional chart levels cannot be drawn, a daily pivot is constructed as the average of the prior high, low, and close. That pivot-point is a next-session reference used to project first and second support and resistance. First resistance equals twice that pivot minus the prior low. First support equals twice that pivot minus the prior high. The second pair adds or subtracts the prior day's range. The construction is presented as a fallback of limited value relative to chart-derived levels.
Retracement bands on the prior swing
Retracement support is constructed as an approximate band around 50 percent of the prior swing, generally between 33 percent and 66 percent. That band matches Fibonacci retracement bands near 38 percent and 62 percent, treated as the widely watched counterparts of one-third and two-thirds pullbacks. A percentage retracement is a support or resistance band placed at a stated fraction of a completed swing and used as a zone rather than an exact print. A correction beyond two thirds is treated as making the near-term trend suspect.
The shared zone as a test of the map
Editorial reading: once a role-reversal support from a prior swing, an extended demand line, a fallback daily pivot, and a Fibonacci retracement band coincide, that overlap is the area to test. If price holds the shared support taken from an earlier high and then exceeds the latest high, the uptrend map remains valid. If those successive supports fail, the higher-high and higher-low sequence is interrupted, and a break of the demand line is treated as further evidence of trend change.
The archive presents this stacking as a way to decide which constructed area is more accurate. It does not present any single print as decisive on its own.
All readings on this track · 38 readings
- 1988Constructing action-reaction lines from two pivots
- 1988Constructing intradaily point-and-figure boxes and pivot ladders
- 1991Constructing layered support and resistance from swings, pivots, and retracements
- 1994Three locks on a day-session order, then a staged exit
- 1994Building a five-level daily pivot grid
- 1996Constructing daily pivot points from session prices
- 1996Higher time frame balance points as a trend and band filter
- 1998Cup-with-handle construction rules
- 2000Pivot levels as a daily trade hypothesis
- 2001Construct a same-session polarity card around the daily pivot
- 2001Trading inside the cup-with-handle before the breakout
- 2005A lower-low rebound as one entry, abstention, and stop routine
- 2006Constructing session pivot maps from the prior high, low, and close
- 2006Constructing a pivot grid for stops and buy-stops
- 2006Monoparametric automatic trendline construction
- 2008Write the exit before the entry
- 2010Dynamic-pivot range grids for trend bias
- 2010Reverse-entry exits for pairs, pivots and support
- 2011Sequencing pairs, futures pivots, and implied volatility
- 2013Constructing Camarilla levels from prior range
- 2013Camarilla levels as a multi-timeframe map of reversion and breakout
- 2013Constructing a camarilla-grid from a completed lookback range
- 2013Constructing daily pivot support and resistance rungs
- 2014Constructing daily pivot levels from prior-session OHLC
- 2014Next-session pivot support and resistance from daily bars
- 2014Constructing session pivot rails from the prior-day range
- 2014Evaluating moving-average, pivot, and support-resistance filters
- 2016Stage a Trailing stop toward a planned target
- 2016Smoothed RSI and full-cut pivots for option-income exits
- 2017Constructing a weekly seasonality pivot scaffold
- 2017Seasonality and pivot points as scenario maps, not forecasts
- 2018Wave pivots, strength filters, and option premium
- 2018Constructing Fibonacci and daily pivot support maps
- 2018Building a daily pivot lattice with Fibonacci rails
- 2019Prior-session pivot channels for same-day entries
- 2019Constructing intraday pivot channels from prior-session levels
- 2020Variable-strength pivot highs as falsifiable entry filters
- 2020A high-volume-pivot long after a multi-week decline