2018issue C0438-40
Wave pivots, strength filters, and option premium
This article teaches a three-gate path. Lock an Elliott-wave idea as a completed-bar pivot hypothesis, let a strength-band filter confirm or reject it, and only then use option-premium context to choose a cash entry, a skip, or a premium-aware structure.
- A wave-derived turning-point pivot can stay fixed after the signal bar closes, so the directional hypothesis is not renumbered as later prices arrive.
- A four-band strength overlay around a neutral zone can accept a buy pivot only when strength is above that zone and a sell pivot only when strength is below it.
- Shaded entry and target bands encode price levels and the expected time window, while a cancel line retires the setup if the entry zone is never reached.
- An over- or underpriced option-premium reading can place the same directional setup into a contract and regime frame rather than only a cash-market plan.
Three gates for one setup
In the archive workflow, Elliott-wave analysis is a reading of impulse and corrective swings used to form a directional hypothesis without a live numeric wave count that can be rewritten as later bars print. That idea is then locked as a pivot point: a completed-bar turning mark that freezes direction and attaches an entry zone, a target zone, and an invalidation line.
A later overlay, option-premium analysis, judges whether listed-option prices look rich or cheap next to the same directional setup, so the idea can be expressed as a premium-aware structure rather than only as a cash-market entry. Between those two steps sits a strength-band, a four-level overlay around a neutral zone that grades how extended a trend is and whether a new pivot is aligned with that regime.
Gate one: freeze the wave idea as a pivot
A wave-derived turning-point pivot can stay fixed after the signal bar closes, so the directional hypothesis is not renumbered as later prices arrive. That freeze is the first gate: the wave reading supplies the impulse and corrective idea, and the completed bar turns it into a pivot that later prices do not rewrite.
The same study can plot five pivot classes spanning very short-term to long-term horizons, and a chart may display any subset of those classes. The class on the chart is a horizon choice, not a new wave count.
What a printed pivot carries
Once a pivot prints, the study can add a shaded entry band, a shaded target band, and a cancel line that retires the setup if price never triggers. Those shaded bands encode both the price levels and the time window in which the entry and the target are expected to occur. The cancel line is a pre-trigger invalidation price that retires the setup if the entry zone is never reached.
After price enters in the indicated direction, a dotted momentum trailing stop can remain active past the first projected target until price hits the stop. Inspecting a pivot can surface pivot type, direction, two entry prices, two targets, and a cancel price. Inspecting a prior pivot can restore its bands and recorded outcome.
DIA medium-term long pivot: cancel, entries, and targets
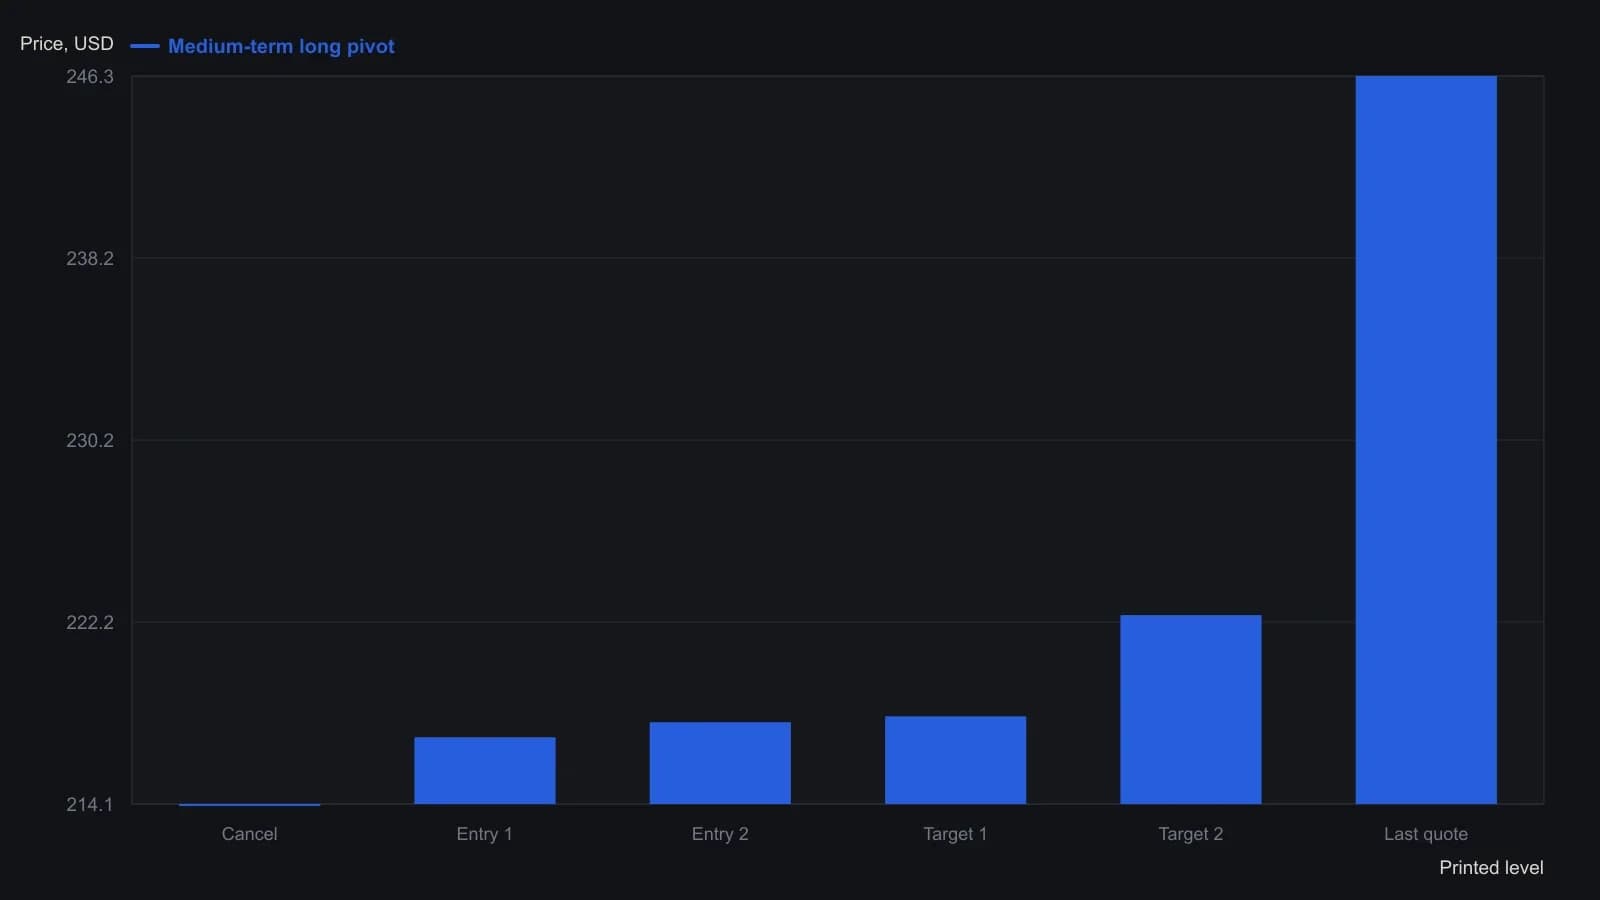
Hover fields belong to the August 2017 medium-term long pivot and do not change after that signal bar closes. Cancel 214.14 sits below the visible price window on the figure. The December last quote is from the same figure’s quote bar, not a pivot field.
Gate two: let strength confirm or reject
A four-band strength overlay around a neutral zone can accept a buy pivot only when strength is above that zone and a sell pivot only when strength is below it. That is the second gate: the pivot remains on the chart, but the overlay decides whether the new mark is aligned with the current regime.
The fourth strength band marks an overextended condition that often precedes reversal or consolidation, yet a pullback from that band need not be treated as a completed trend change. Alignment with the zone is a filter on the pivot, not a claim that every retreat from the outer band has finished the trend.
Recency and a second filter
A scanner can require a chosen pivot class and direction inside a recency window of the current bar, the prior bar, the last three bars, or the last five bars, and can add a selected strength band as a second filter. The recency window keeps the hypothesis close to the bar that printed it. The selected strength band repeats the same confirm-or-reject test used on the chart.
Gate three: place the setup in a premium frame
Only after the pivot has printed and the strength-band filter has accepted it does option-premium analysis enter the path. An over- or underpriced option-premium reading, together with a pivot-linked strategy builder, can place the same directional setup into a contract and regime frame rather than only a cash-market plan.
The directional hypothesis does not change at this gate. The overlay asks whether listed-option prices look rich or cheap next to that same setup, so the idea can stay a cash entry, be skipped, or be rewritten as a premium-aware structure.
Editorial reading of the sequence
TradersWeek, in this editorial reading, does not treat the archive as having required this order. The archive supplies a frozen wave pivot, a strength-band overlay, and an option-premium overlay. The three-gate path is the editorial way to keep those jobs separate: first a falsifiable completed-bar hypothesis, then a regime filter that can reject it, then a premium reading that decides how, or whether, the same setup is expressed.
All readings on this track · 38 readings
- 1988Constructing action-reaction lines from two pivots
- 1988Constructing intradaily point-and-figure boxes and pivot ladders
- 1991Constructing layered support and resistance from swings, pivots, and retracements
- 1994Three locks on a day-session order, then a staged exit
- 1994Building a five-level daily pivot grid
- 1996Constructing daily pivot points from session prices
- 1996Higher time frame balance points as a trend and band filter
- 1998Cup-with-handle construction rules
- 2000Pivot levels as a daily trade hypothesis
- 2001Construct a same-session polarity card around the daily pivot
- 2001Trading inside the cup-with-handle before the breakout
- 2005A lower-low rebound as one entry, abstention, and stop routine
- 2006Constructing session pivot maps from the prior high, low, and close
- 2006Constructing a pivot grid for stops and buy-stops
- 2006Monoparametric automatic trendline construction
- 2008Write the exit before the entry
- 2010Dynamic-pivot range grids for trend bias
- 2010Reverse-entry exits for pairs, pivots and support
- 2011Sequencing pairs, futures pivots, and implied volatility
- 2013Constructing Camarilla levels from prior range
- 2013Camarilla levels as a multi-timeframe map of reversion and breakout
- 2013Constructing a camarilla-grid from a completed lookback range
- 2013Constructing daily pivot support and resistance rungs
- 2014Constructing daily pivot levels from prior-session OHLC
- 2014Next-session pivot support and resistance from daily bars
- 2014Constructing session pivot rails from the prior-day range
- 2014Evaluating moving-average, pivot, and support-resistance filters
- 2016Stage a Trailing stop toward a planned target
- 2016Smoothed RSI and full-cut pivots for option-income exits
- 2017Constructing a weekly seasonality pivot scaffold
- 2017Seasonality and pivot points as scenario maps, not forecasts
- 2018Wave pivots, strength filters, and option premium
- 2018Constructing Fibonacci and daily pivot support maps
- 2018Building a daily pivot lattice with Fibonacci rails
- 2019Prior-session pivot channels for same-day entries
- 2019Constructing intraday pivot channels from prior-session levels
- 2020Variable-strength pivot highs as falsifiable entry filters
- 2020A high-volume-pivot long after a multi-week decline