2019issue C0244-45
Prior-session pivot channels for same-day entries
Prior-session support and resistance are marked on a two-session chart and extended as a prior-session-channel. Longs are built above a pivot-region only after a 0.50 clearance-offset, and a starter-probe is bound by a capped initial stop and a resistance-trail.
- Mark prior-session support and resistance as horizontal lines on a two-session candlestick chart, then extend them into the current session as a prior-session-channel for entry and exit decisions.
- Construct longs above a prior support zone treated as a pivot-region, require a 0.50 clearance-offset above the obvious support line and above the obvious resistance line, and avoid buying immediately beneath prior resistance.
- Tighten a resistance-trail as an open long approaches prior resistance, and apply a 0.50 maximum-stop-distance to both the initial stop and the trailing stop on day trades in the 20 to 70 price range.
- Open with a starter-probe of 50 to 100 shares so the initial loss stays bounded, and limit the construction to instruments with at least 15,000 shares per minute and a daily range of one to two points or more.
The last session as a map
Prior-session support and resistance are marked as horizontal lines on a two-session candlestick chart. Those lines are extended into the current session as a prior-session-channel for entry and exit decisions.
Prior-session support, resistance, and OHLC points are treated as levels that both discretionary traders and systematic order-routing programs observe.
Where a long is allowed
Longs are constructed above a prior support zone treated as a pivot-region rather than a single print. Buying immediately beneath a prior resistance zone is avoided.
A 0.50 clearance-offset is added above the obvious support line, and above the obvious resistance line, before a long is accepted.
A path map from the prior session
Prior-session cup depth, opening-range breakout height, and the duration of internal trends are used as a path map for the current session.
COMEX gold continuous contract, 236-minute bars
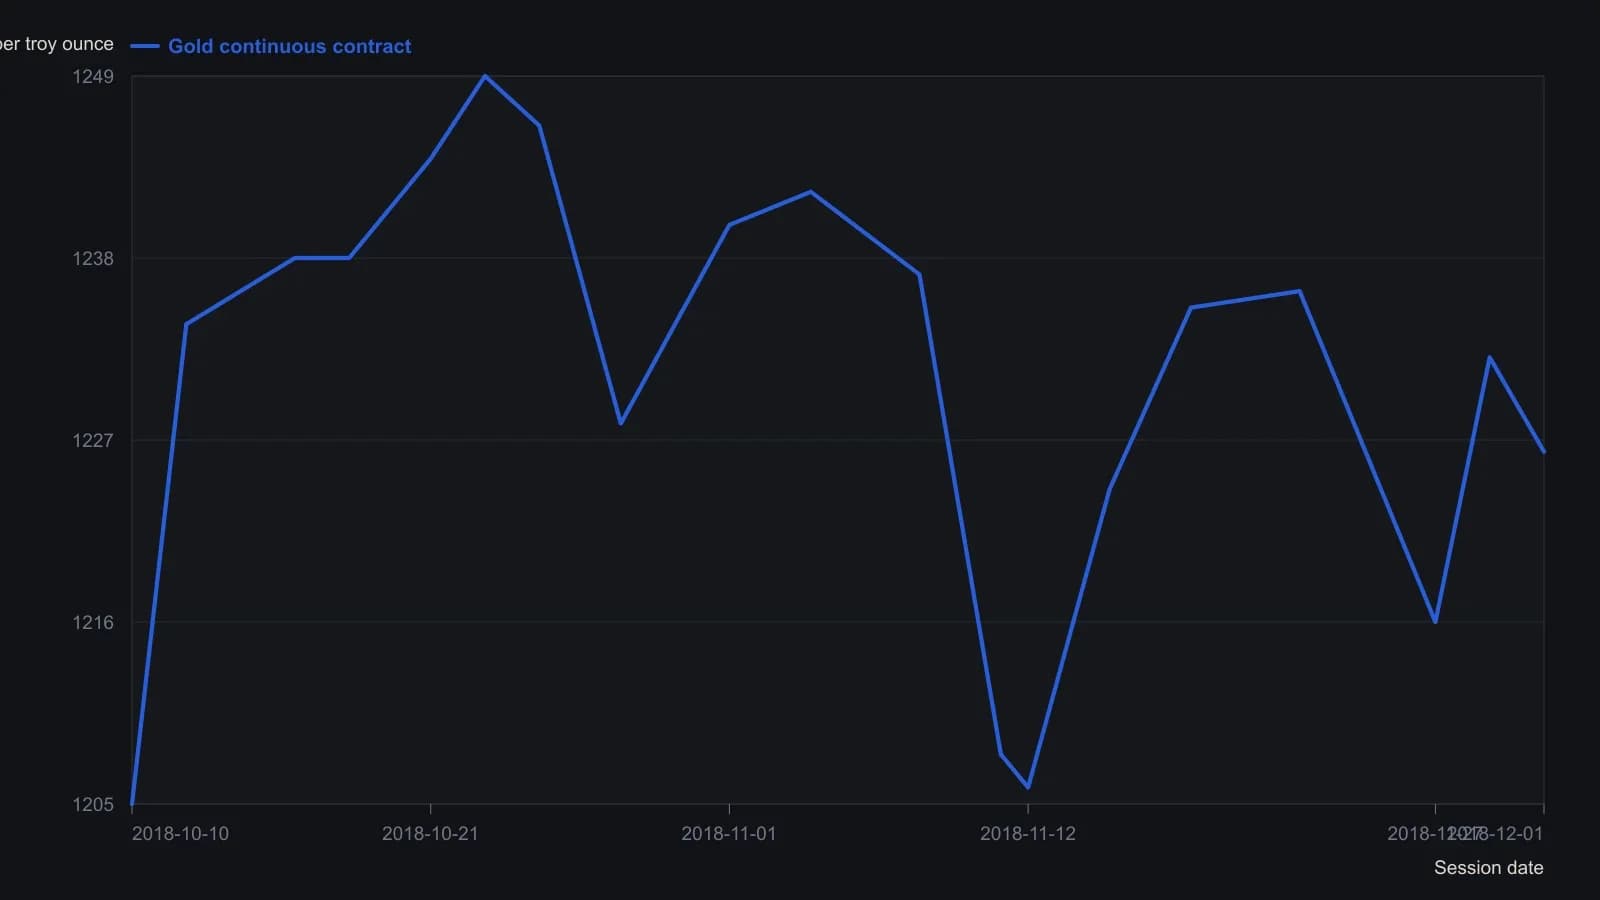
Individual 236-minute candles cannot be resolved on the magazine raster. Points are swing and labeled-date prices rounded to the nearest dollar, except the last print stated as 1,226.3 in the quote bar.
Stops, first size, and eligibility
Once an open long approaches prior resistance, the trailing stop is tightened. That tighter exit is the resistance-trail, and it stays attached to the same prior-session-channel that defined the long.
For day trades in the 20 to 70 price range, a maximum-stop-distance of 0.50 is applied to both the initial stop and the trailing stop.
The first size is a starter-probe of 50 to 100 shares so the initial loss stays bounded. Eligible instruments are those with at least 15,000 shares per minute and a daily range of one to two points or more.
All readings on this track · 38 readings
- 1988Constructing action-reaction lines from two pivots
- 1988Constructing intradaily point-and-figure boxes and pivot ladders
- 1991Constructing layered support and resistance from swings, pivots, and retracements
- 1994Three locks on a day-session order, then a staged exit
- 1994Building a five-level daily pivot grid
- 1996Constructing daily pivot points from session prices
- 1996Higher time frame balance points as a trend and band filter
- 1998Cup-with-handle construction rules
- 2000Pivot levels as a daily trade hypothesis
- 2001Construct a same-session polarity card around the daily pivot
- 2001Trading inside the cup-with-handle before the breakout
- 2005A lower-low rebound as one entry, abstention, and stop routine
- 2006Constructing session pivot maps from the prior high, low, and close
- 2006Constructing a pivot grid for stops and buy-stops
- 2006Monoparametric automatic trendline construction
- 2008Write the exit before the entry
- 2010Dynamic-pivot range grids for trend bias
- 2010Reverse-entry exits for pairs, pivots and support
- 2011Sequencing pairs, futures pivots, and implied volatility
- 2013Constructing Camarilla levels from prior range
- 2013Camarilla levels as a multi-timeframe map of reversion and breakout
- 2013Constructing a camarilla-grid from a completed lookback range
- 2013Constructing daily pivot support and resistance rungs
- 2014Constructing daily pivot levels from prior-session OHLC
- 2014Next-session pivot support and resistance from daily bars
- 2014Constructing session pivot rails from the prior-day range
- 2014Evaluating moving-average, pivot, and support-resistance filters
- 2016Stage a Trailing stop toward a planned target
- 2016Smoothed RSI and full-cut pivots for option-income exits
- 2017Constructing a weekly seasonality pivot scaffold
- 2017Seasonality and pivot points as scenario maps, not forecasts
- 2018Wave pivots, strength filters, and option premium
- 2018Constructing Fibonacci and daily pivot support maps
- 2018Building a daily pivot lattice with Fibonacci rails
- 2019Prior-session pivot channels for same-day entries
- 2019Constructing intraday pivot channels from prior-session levels
- 2020Variable-strength pivot highs as falsifiable entry filters
- 2020A high-volume-pivot long after a multi-week decline