1988issue C091-5
Constructing intradaily point-and-figure boxes and pivot ladders
Assign a box size and reversal criterion so only a full increment can occupy the map, then project a five-level ladder from the prior session high, low, and close. Editorial reading: each new column or tagged level is a hypothesis the next print can falsify.
- A point-and-figure map is constructed by assigning a box size in ticks per row and a reversal criterion in boxes; the reversal criterion withholds a column change until the counter-move is large enough.
- A box is filled only after a full increment prints. A smaller dip is ignored, and construction moves one column right only after the full reversal count is met from the last filled extreme.
- The column-change rule treats a new advance column as a long hypothesis and a new decline column as a cover-and-short hypothesis, and that reading depends on a workable box-and-reversal pair.
- The next-session ladder is built from the prior high, low, and close: central pivot, first support, first resistance, second support, and second resistance are the levels to watch.
Assign the box and the reversal
A point-and-figure map is constructed by assigning a box size in ticks per row and a reversal count in boxes. The reversal criterion is the filter that withholds a column change until the counter-move is large enough.
A two-tick box paired with a three-box reversal withholds recognition of a turn until price has moved six ticks from the last filled box.
A box is filled only after a full increment prints. With a two-tick box, a rise that stops at 94-07 after 94-06 is filled does not occupy the 94-08 row.
A dip that is smaller than the reversal distance is ignored. Construction moves one column right and switches mark type only after the full reversal count is met from the last filled extreme.
Read columns and formations
An advance column is a vertical stack of advance marks begun after a qualifying reversal higher, and each new stack occupies the next column to the right. A decline column is the matching stack after a qualifying reversal lower.
The simplest column-change reading is to treat a new advance column as a long hypothesis and a new decline column as a cover-and-short hypothesis. That column-change rule is specified as depending on a workable box-and-reversal pair.
In a frequently reversing, non-trending tape, that column-change reading is described as producing a sequence of relatively small losing trades rather than a single large one.
Formations on the filtered map are read analogously to bar-chart patterns. Buy diagrams have matching sell diagrams obtained by flipping the same shapes across a horizontal axis.
After a break from a formation, expected vertical travel is compared with the number of columns the formation spanned. That comparison is the horizontal count.
Project a five-level ladder
The next-session ladder is built from the prior high, low, and close. The central pivot is their mean. The next session may treat the central pivot as support if trade is above it or as resistance if trade is below it.
First support is twice the central pivot minus the prior session high. First resistance is twice the central pivot minus the prior session low. Second support is the central pivot minus the prior session high-to-low range. Second resistance is the central pivot plus that range.
Using a prior session at 56.49 high, 56.27 low, and 56.43 close, the constructed ladder is 56.62, 56.52, 56.40, 56.30, and 56.18 from second resistance down to second support. Those prints are the levels to watch the following session.
June 1987 Deutschemark futures pivot ladder after 21 May
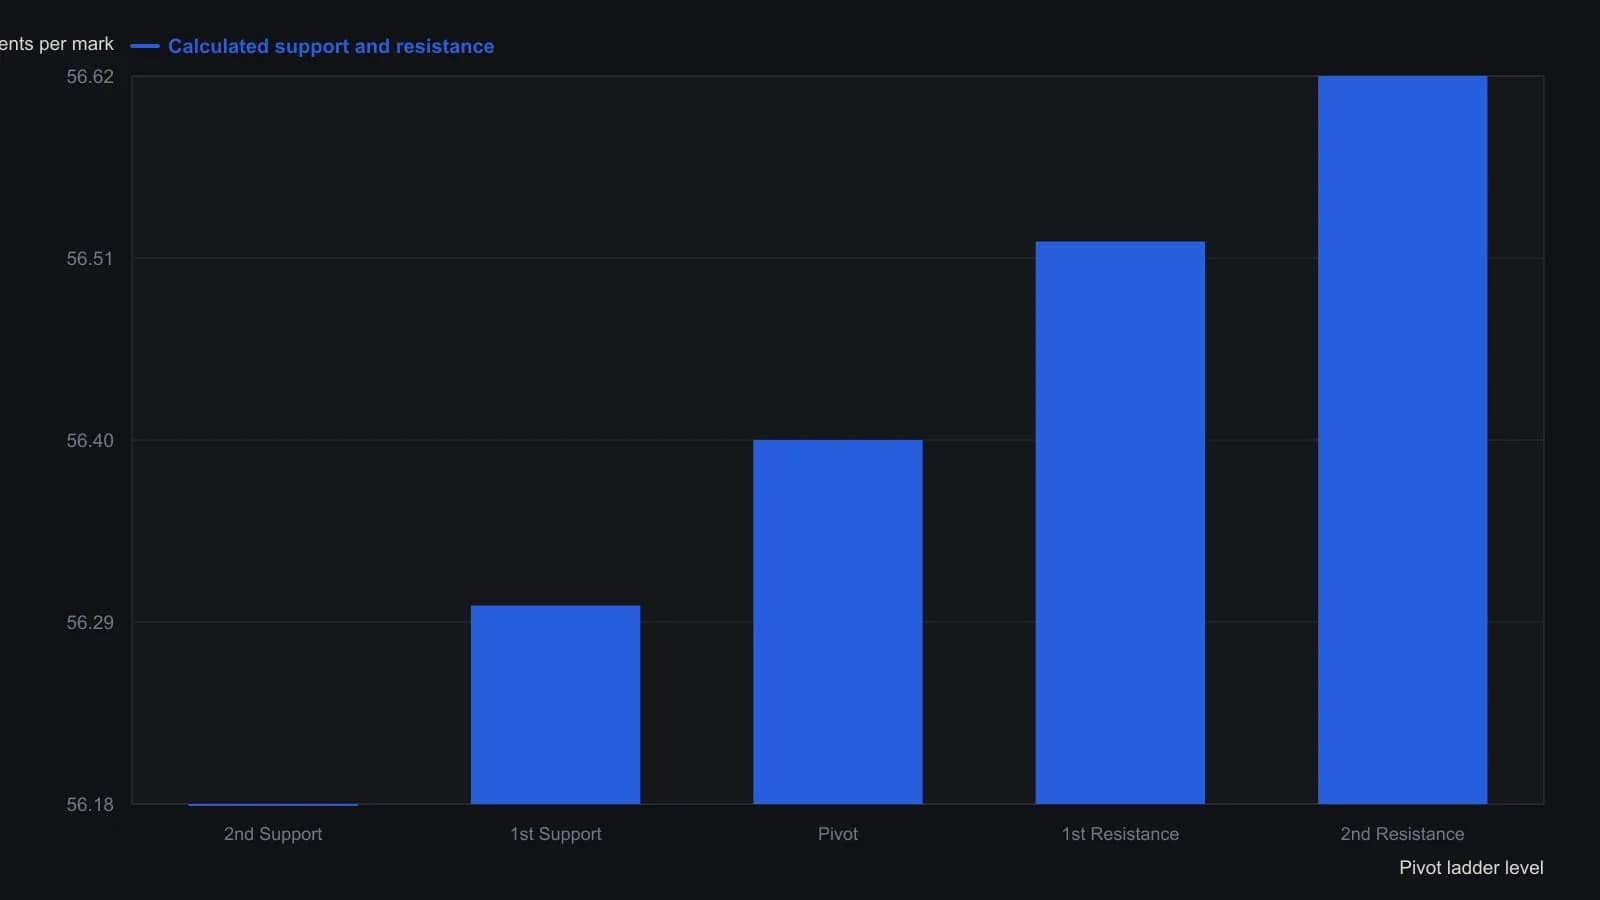
Pivot is the average of the prior session high, low and close. First support and resistance are twice the pivot minus the high or low; second support and resistance add or subtract the prior day's range. The source's rounded printed levels are used as given.
All readings on this track · 38 readings
- 1988Constructing action-reaction lines from two pivots
- 1988Constructing intradaily point-and-figure boxes and pivot ladders
- 1991Constructing layered support and resistance from swings, pivots, and retracements
- 1994Three locks on a day-session order, then a staged exit
- 1994Building a five-level daily pivot grid
- 1996Constructing daily pivot points from session prices
- 1996Higher time frame balance points as a trend and band filter
- 1998Cup-with-handle construction rules
- 2000Pivot levels as a daily trade hypothesis
- 2001Construct a same-session polarity card around the daily pivot
- 2001Trading inside the cup-with-handle before the breakout
- 2005A lower-low rebound as one entry, abstention, and stop routine
- 2006Constructing session pivot maps from the prior high, low, and close
- 2006Constructing a pivot grid for stops and buy-stops
- 2006Monoparametric automatic trendline construction
- 2008Write the exit before the entry
- 2010Dynamic-pivot range grids for trend bias
- 2010Reverse-entry exits for pairs, pivots and support
- 2011Sequencing pairs, futures pivots, and implied volatility
- 2013Constructing Camarilla levels from prior range
- 2013Camarilla levels as a multi-timeframe map of reversion and breakout
- 2013Constructing a camarilla-grid from a completed lookback range
- 2013Constructing daily pivot support and resistance rungs
- 2014Constructing daily pivot levels from prior-session OHLC
- 2014Next-session pivot support and resistance from daily bars
- 2014Constructing session pivot rails from the prior-day range
- 2014Evaluating moving-average, pivot, and support-resistance filters
- 2016Stage a Trailing stop toward a planned target
- 2016Smoothed RSI and full-cut pivots for option-income exits
- 2017Constructing a weekly seasonality pivot scaffold
- 2017Seasonality and pivot points as scenario maps, not forecasts
- 2018Wave pivots, strength filters, and option premium
- 2018Constructing Fibonacci and daily pivot support maps
- 2018Building a daily pivot lattice with Fibonacci rails
- 2019Prior-session pivot channels for same-day entries
- 2019Constructing intraday pivot channels from prior-session levels
- 2020Variable-strength pivot highs as falsifiable entry filters
- 2020A high-volume-pivot long after a multi-week decline