2014issue C1154-56
Constructing daily pivot levels from prior-session OHLC
A daily pivot map is built from the completed prior session's high, low, and close rather than from the still-forming bar. Those prices become a pivot ladder held constant as candidate support and resistance for the next session.
- A daily pivot map is built from the completed prior session's high, low, and close rather than from the still-forming bar.
- The central pivot is the arithmetic mean of that prior high, low, and close.
- On intraday charts, session roll is set with a UTC offset so the day starts at midnight in the chosen zone; that offset is unused on daily or higher intervals.
- The finished levels are candidate support and resistance for the next session and can be shown as an intraday overlay on 30-minute and five-minute bars.
Start from a completed session
A daily pivot map is built from the completed prior session's high, low, and close rather than from the still-forming bar.
Editorial interpretation: treat the daily pivot ladder as a session-boundary construction problem. First decide when yesterday ends so high, low, and close are unambiguous, then freeze those three prices into a fixed, testable support-resistance grid for the next session.
Set the session roll before the prices
Session roll is the clock rule that starts a new day, often aligned to midnight in a chosen UTC offset on intraday charts. Until that rule is fixed, the prior session's high, low, and close are not yet unambiguous.
On intraday charts, one construction asks for a UTC offset in the range -12 to 13 so the session rolls at midnight in the chosen zone. That offset is unused on daily or higher intervals.
Compute the central pivot and first rungs
The central pivot is the midpoint of the prior session, computed as the average of that session's high, low, and close. In this workflow that midpoint is the arithmetic mean of the prior high, low, and close.
First resistance equals twice the central pivot minus the prior low. First support equals twice the central pivot minus the prior high.
Space further rungs from the prior-session range
Further support and resistance rungs are derived from the prior session's high-low range, either added to or subtracted from the central pivot or the first rungs.
That prior-session range is the distance between the completed session's high and low, used to space additional support and resistance rungs.
The result is a pivot ladder: the set of central, support, and resistance levels held constant through the following session so price can confirm or reject them.
Show the same ladder on the next session
The finished levels are intended as candidate support and resistance for the next session and are shown overlaid on 30-minute and five-minute bars.
An intraday overlay plots the completed daily ladder on a lower-interval chart so the same fixed levels can be observed bar by bar.
Some charting environments already include a floor-trader pivot study, so the same prior-session construction can be invoked without writing custom code.
At least one implementation computes the next session's levels from completed daily bars and does not plot those levels on a real-time alert chart.
SPY daily pivot ladder after the prior session
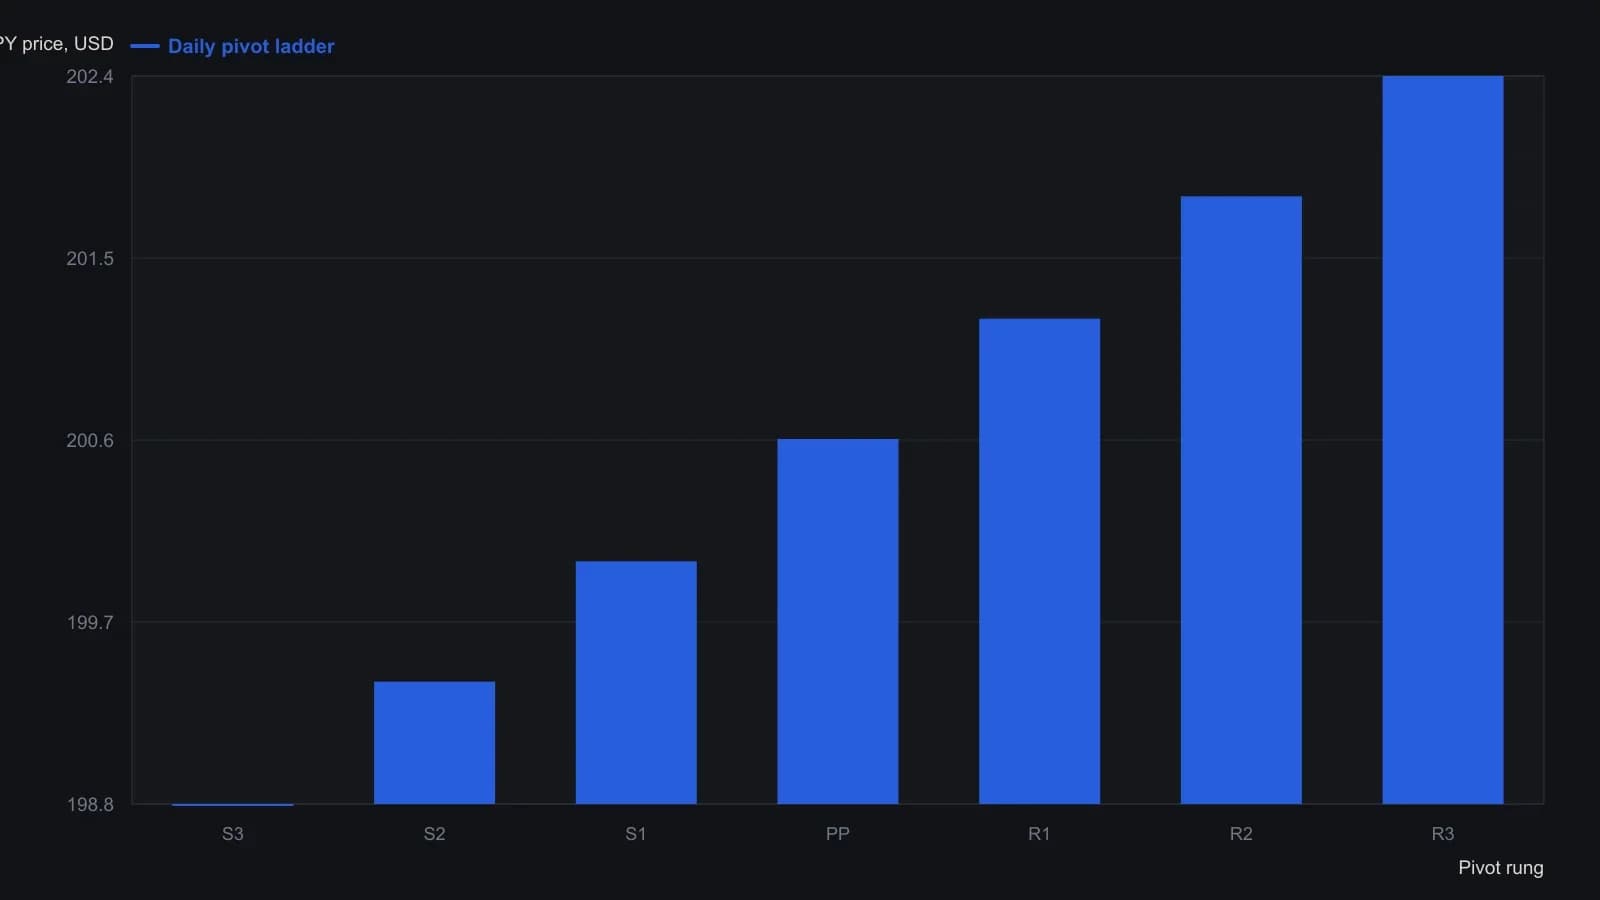
Classic floor-trader identities: PP is the prior-session (H+L+C)/3; R1 and S1 mirror the opposite extreme around PP; R2/S2 and R3/S3 add or subtract that session's range. The figure draws a new frozen ladder after each session roll; only the right-hand session labels every rung.
All readings on this track · 38 readings
- 1988Constructing action-reaction lines from two pivots
- 1988Constructing intradaily point-and-figure boxes and pivot ladders
- 1991Constructing layered support and resistance from swings, pivots, and retracements
- 1994Three locks on a day-session order, then a staged exit
- 1994Building a five-level daily pivot grid
- 1996Constructing daily pivot points from session prices
- 1996Higher time frame balance points as a trend and band filter
- 1998Cup-with-handle construction rules
- 2000Pivot levels as a daily trade hypothesis
- 2001Construct a same-session polarity card around the daily pivot
- 2001Trading inside the cup-with-handle before the breakout
- 2005A lower-low rebound as one entry, abstention, and stop routine
- 2006Constructing session pivot maps from the prior high, low, and close
- 2006Constructing a pivot grid for stops and buy-stops
- 2006Monoparametric automatic trendline construction
- 2008Write the exit before the entry
- 2010Dynamic-pivot range grids for trend bias
- 2010Reverse-entry exits for pairs, pivots and support
- 2011Sequencing pairs, futures pivots, and implied volatility
- 2013Constructing Camarilla levels from prior range
- 2013Camarilla levels as a multi-timeframe map of reversion and breakout
- 2013Constructing a camarilla-grid from a completed lookback range
- 2013Constructing daily pivot support and resistance rungs
- 2014Constructing daily pivot levels from prior-session OHLC
- 2014Next-session pivot support and resistance from daily bars
- 2014Constructing session pivot rails from the prior-day range
- 2014Evaluating moving-average, pivot, and support-resistance filters
- 2016Stage a Trailing stop toward a planned target
- 2016Smoothed RSI and full-cut pivots for option-income exits
- 2017Constructing a weekly seasonality pivot scaffold
- 2017Seasonality and pivot points as scenario maps, not forecasts
- 2018Wave pivots, strength filters, and option premium
- 2018Constructing Fibonacci and daily pivot support maps
- 2018Building a daily pivot lattice with Fibonacci rails
- 2019Prior-session pivot channels for same-day entries
- 2019Constructing intraday pivot channels from prior-session levels
- 2020Variable-strength pivot highs as falsifiable entry filters
- 2020A high-volume-pivot long after a multi-week decline