1993issue C031-12
One job per lookback in a breadth-based option-income procedure
Four breadth series can be arranged as a bounded thrust oscillator or as an issues-volume ratio. The editorial task is to give each moving-average length a single job so an index option-income procedure can be scored as one rule set that also includes standing aside.
- The same four inputs, advancing issues, advancing volume, declining issues, and declining volume, can form a thrust oscillator confined to -1 to +1 or an issues-volume ratio that is bullish only between 0 and 1.
- Editorial reading: give each average length one job. A shorter average may propose a state. The second length in a lookback pair may only confirm that state or veto the trade.
- In a 13-year window a 21-day oscillator average at -0.3 coincided with a significant bottom in progress on six occasions, while a reading above +0.3 was not treated as a matching top signal.
- The documented option-income procedure used four-day issues-volume-ratio averages outside 13-day percentage bands, and fell back to a same-direction four-day and 13-day cross plus index confirmation when oscillator bands were too narrow.
Two arrangements of the same four series
The archive starts with four daily breadth inputs: advancing issues, advancing volume, declining issues, and declining volume. Those inputs can be combined into a thrust oscillator whose daily value is confined to the interval from -1 to +1. The same four inputs can also be arranged as an issues-volume ratio that is bullish only between 0 and 1, with no theoretical upper bound on the bearish side and observed bearish readings above 10.
Editorial reading: treat the two arrangements as shared raw material. Do not treat them as interchangeable substitutes inside the same rule.
Unsmoothed readings and short smoothers
In the February to August 1992 window, unsmoothed daily oscillator readings mostly sat between -0.5 and +0.5 and were judged too jagged for overbought or oversold use. One-day readings near -0.9 lined up with index lows.
Four-day, 13-day, and 35-day averages were used as extremely short, short, and intermediate smoothers. In that window all three averages bottomed in April with the index, and a four-day reading at or above +0.5 was treated as a short-term top condition.
Editorial reading: the four-day average may propose a short-term top. The 13-day and 35-day averages in that window are not given the same job.
Daily NYSE thrust oscillator around the 1987 break
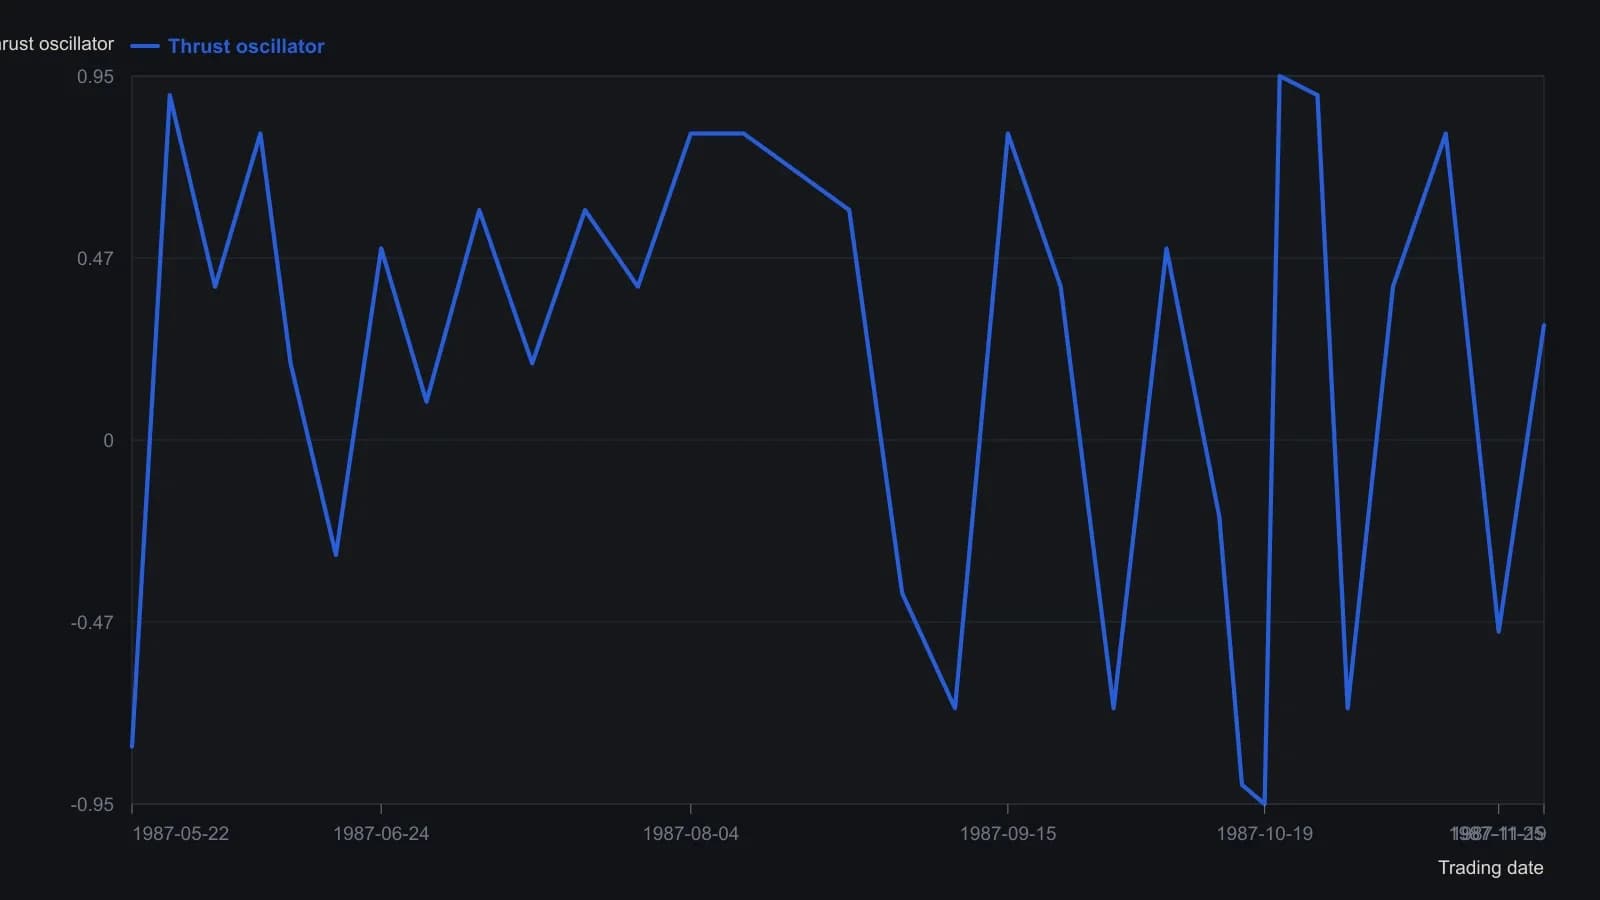
Digitized from a raster of the daily pane; only turning points and roughly weekly samples are given, so individual sessions may sit off these readings by about 0.1. The companion OEX price pane uses another scale and is omitted.
Longer lookbacks and a 21-day and 55-day pair
In the 1987 window the 35-day average peaked in July, later diverged from the index, and crossed below zero in September. An 89-day average also crossed below zero several sessions before 16 October 1987. A 150-day average crossed only after that date and was judged too long for that episode.
Across a 13-year review window, a 21-day average of the oscillator reaching -0.3 coincided with a significant market bottom in progress on six occasions. A reading above +0.3 on that same average was not treated as a matching top signal.
A 21-day and 55-day pair supplied a trend-direction rule. At the August 1982 and December 1987 bottoms the 55-day average diverged from price one to two months after the 21-day average exceeded -0.3. A 55-day zero-line cross was treated as more informative after a same-direction 21-day zero-line cross.
Editorial reading: the 21-day average may propose a bottom-in-progress state at -0.3. The 55-day average may confirm trend direction or delay that confirmation. It does not reopen a top question that the 21-day average was never assigned.
Shape correspondence with a windowed advance-decline series
A 13-day average of the oscillator closely tracked a 13-day windowed advance-decline series, sometimes crossing zero one to four days earlier or later. Similar shape correspondence appeared at 30-day and 150-day lengths in the 1979-80, 1982-83, and 1990-92 windows.
Editorial reading: shared shape is not a license to swap the windowed advance-decline series into the option-income procedure in place of the oscillator.
Scoring the option-income procedure, including standing aside
The documented option-income procedure treated a four-day issues-volume-ratio average below 0.7 and outside a 15 percent lower band of the 13-day average as a short-term condition that specified selling calls, buying puts, or using a spread. It treated a four-day average above 1.3 outside the upper band as a short-term bullish condition. Those band events typically appeared one to three days before the index move.
Percentage bands around a 13-day average of the thrust oscillator were too narrow to use. The fallback procedure acted only when the four-day average crossed the 13-day average in the direction of the 13-day average and required a separate index-based confirmation before an option trade.
Editorial reading: if the named averages do not meet a stated condition, or if the index confirmation is missing, the procedure stands aside. Abstention is part of the score, not a gap in the rule set.
All readings on this track · 14 readings
- 1989When broker advice replaces your rules
- 1990Constructing hybrid trend and option-income rules
- 1992Long-call cash sleeve as an option-income case study
- 1993One job per lookback in a breadth-based option-income procedure
- 2001Expire-worthless folklore and option-income risk
- 2005Conservative option writing after a climate and structure check
- 2007Unhedged option income with volume and the midterm trend
- 2007When option income ignores the implied-volatility range and liquidity
- 2008Horizon-first income spreads and expiration-week volatility
- 2014Seasonal oil calls across a tracking fund and an energy equity
- 2017Shoulder-season crude, the gasoline rebuild, and a put-income overlay
- 2017Seasonal energy window with a defined-risk call
- 2017Constructing short guts for option income decay
- 2018Seasonality as a holding-regime choice in commodity markets