2020issue C117
A high-volume-pivot long after a multi-week decline
After at least two weeks of decline, this construction waits for a small reversal, requires a volume-multiple on two consecutive rising sessions, and uses a move of at least 0.50 dollars above the two-day-pivot-high as the long trigger, with an initial-stop and a trailing-stop bounding risk.
- The scan begins on charts with at least two weeks of sustained decline and waits for a small upside reversal before any entry rule is applied.
- A high-volume-pivot needs two consecutive rising sessions at a volume-multiple; the long trigger is a move of at least 0.50 dollars above the two-day-pivot-high.
- An initial-stop sits one dollar below the entry day's low, and a two-dollar trailing-stop keeps the remaining loss bound after entry.
- Bottom-fishing near a suspected low is presented as frequently failing when a brief bounce continues lower, so exceptional volume is required at the pivot.
Where the scan begins
The construction begins with charts that have at least two weeks of sustained decline. It then waits for a small upside reversal. No entry rule is applied until that sequence is present.
Volume-price confirmation at the high-volume-pivot
Volume-price confirmation requires at least two consecutive sessions with rising prices and a volume-multiple, meaning daily volume of at least two to three times the average.
A high-volume-pivot is a turn after a multi-week decline that is treated as a setup only when that unusual volume arrives with the first rising days.
The long trigger at the two-day-pivot-high
The two-day-pivot-high is the high of that pair of consecutive high-volume up days. The long trigger is a move of at least 0.50 dollars above that high.
Initial-stop and trailing-stop
Risk is bounded with an initial-stop placed one dollar below the low of the day the position is opened. After entry, a trailing-stop of two dollars is used as a follow-along exit so the remaining loss stays bound as price moves.
SQQQ daily price through the 2020 downtrend and September pivot
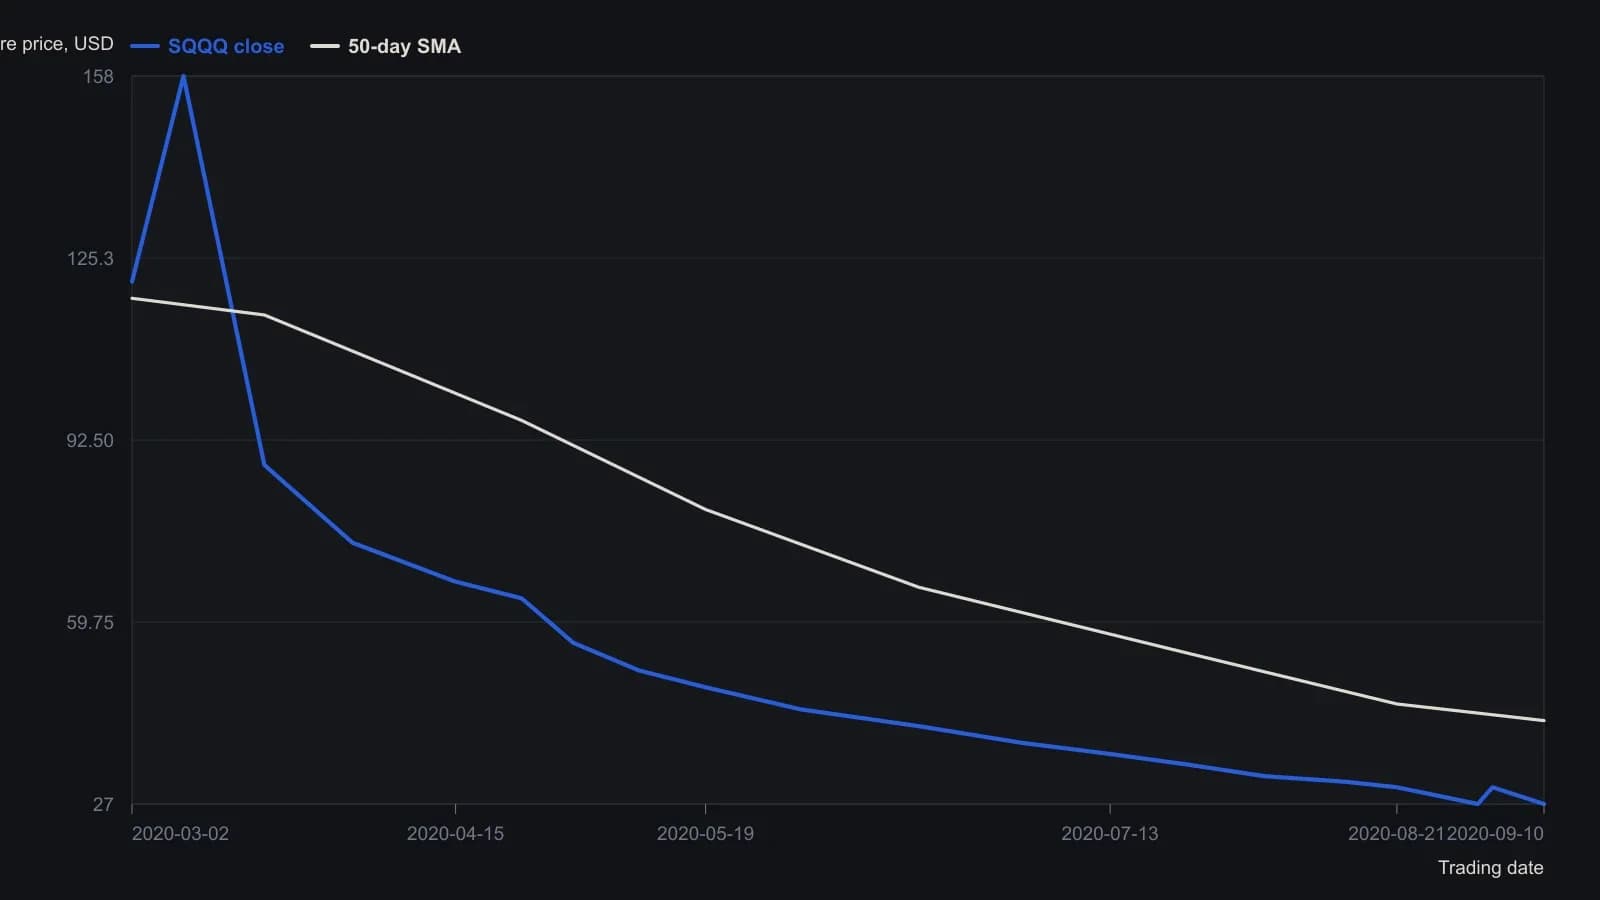
Closes are approximate readings at labeled dates and visible turns, rounded to the nearest dollar. Source candles are too small to recover exact session OHLC. Volume is annotated on the original as a late spike near 150 million shares but cannot share this price axis.
Buyer groups in the pivot narrative
The pivot narrative names two buyer groups. The first is short-covering, buying by large short holders closing positions, labeled a short squeeze and described as the primary flow behind a high-volume turn. The second is speculative longs.
Cues that sit outside the core rule
On the illustrated chart, a move above the fifty-period-average, a 50-period simple moving average, is cited as an additional cue that a pivot long is indicated.
A hammer or bullish engulfing at a relevant chart location is described as a desirable extra confirmation, not as the core volume-pivot rule.
Why bottom-fishing is treated as unreliable
Buying near a suspected low is presented as frequently failing when a brief bounce continues lower. That is why exceptional volume is required at the pivot.
Bottom-fishing, buying near an assumed low before the decline has clearly failed, is treated as unreliable without volume confirmation.
All readings on this track · 38 readings
- 1988Constructing action-reaction lines from two pivots
- 1988Constructing intradaily point-and-figure boxes and pivot ladders
- 1991Constructing layered support and resistance from swings, pivots, and retracements
- 1994Three locks on a day-session order, then a staged exit
- 1994Building a five-level daily pivot grid
- 1996Constructing daily pivot points from session prices
- 1996Higher time frame balance points as a trend and band filter
- 1998Cup-with-handle construction rules
- 2000Pivot levels as a daily trade hypothesis
- 2001Construct a same-session polarity card around the daily pivot
- 2001Trading inside the cup-with-handle before the breakout
- 2005A lower-low rebound as one entry, abstention, and stop routine
- 2006Constructing session pivot maps from the prior high, low, and close
- 2006Constructing a pivot grid for stops and buy-stops
- 2006Monoparametric automatic trendline construction
- 2008Write the exit before the entry
- 2010Dynamic-pivot range grids for trend bias
- 2010Reverse-entry exits for pairs, pivots and support
- 2011Sequencing pairs, futures pivots, and implied volatility
- 2013Constructing Camarilla levels from prior range
- 2013Camarilla levels as a multi-timeframe map of reversion and breakout
- 2013Constructing a camarilla-grid from a completed lookback range
- 2013Constructing daily pivot support and resistance rungs
- 2014Constructing daily pivot levels from prior-session OHLC
- 2014Next-session pivot support and resistance from daily bars
- 2014Constructing session pivot rails from the prior-day range
- 2014Evaluating moving-average, pivot, and support-resistance filters
- 2016Stage a Trailing stop toward a planned target
- 2016Smoothed RSI and full-cut pivots for option-income exits
- 2017Constructing a weekly seasonality pivot scaffold
- 2017Seasonality and pivot points as scenario maps, not forecasts
- 2018Wave pivots, strength filters, and option premium
- 2018Constructing Fibonacci and daily pivot support maps
- 2018Building a daily pivot lattice with Fibonacci rails
- 2019Prior-session pivot channels for same-day entries
- 2019Constructing intraday pivot channels from prior-session levels
- 2020Variable-strength pivot highs as falsifiable entry filters
- 2020A high-volume-pivot long after a multi-week decline