2013issue C0358-62
Constructing Camarilla levels from prior range
A camarilla-grid is a pivot-point overlay of ten horizontal support-resistance lines drawn from one lookback window of high, low, and close. The inner S3-R3 corridor and the outer rails give two different hypotheses from the same prior-range geometry.
- Eight basic Camarilla levels are computed from session high, session low, and session close, and a fifth support and resistance pair is added to handle breakouts.
- The first four levels equal the lookback close plus or minus the lookback-range multiplied by 1.1 divided by 12, 6, 4, or 2. The fifth resistance is the lookback close times the lookback high divided by the lookback low, and the fifth support is the close mirrored across that resistance.
- An open inside the S3-R3 corridor is a defined support-resistance setup. Sample rule sets treat S3 and R3 crossings as reversal conditions and S4 and R4 crossings as breakout conditions, with the fifth pair used when price extends beyond those outer rails.
- The same range-scaled formulas can be applied on a chosen multi-bar window. Computed values depend on both the selected time-frame length and the analysis start point.
A pivot-point ladder from one window
A camarilla-grid is a pivot-point overlay: a session-based price ladder derived from prior high, low, and close, realized as a Camarilla nest of levels rather than a classic floor-trader mid-pivot.
Eight basic levels are computed from session high, session low, and session close. Fifth support and resistance levels are added to handle breakouts. A complete overlay draws five resistance lines and five support lines as horizontal levels from the selected computation window.
Those lines are support-resistance bands projected from prior-range geometry and used as bounce, failure, or breakout reference prices.
How the levels are computed
The lookback-range is the high-minus-low width of the selected computation window.
The first four resistance and support levels equal the lookback close plus or minus the lookback-range multiplied by 1.1 divided by 12, 6, 4, or 2.
The fifth resistance equals the lookback close times the lookback high divided by the lookback low. The fifth support is the close mirrored across that fifth resistance.
The same range-scaled formulas can be applied on a chosen multi-bar window rather than only a single daily session.
The open-inside corridor and the outer rails
One defined support-resistance setup is the case in which the market opens inside the S3-R3 corridor. That inner pair is the open-inside reference for a first support-and-resistance hypothesis.
Sample rule sets treat S3 and R3 crossings as reversal conditions and treat S4 and R4 crossings as breakout conditions, with the fifth pair used when price extends beyond those outer rails.
Camarilla S3–R3 system equity on one S&P contract
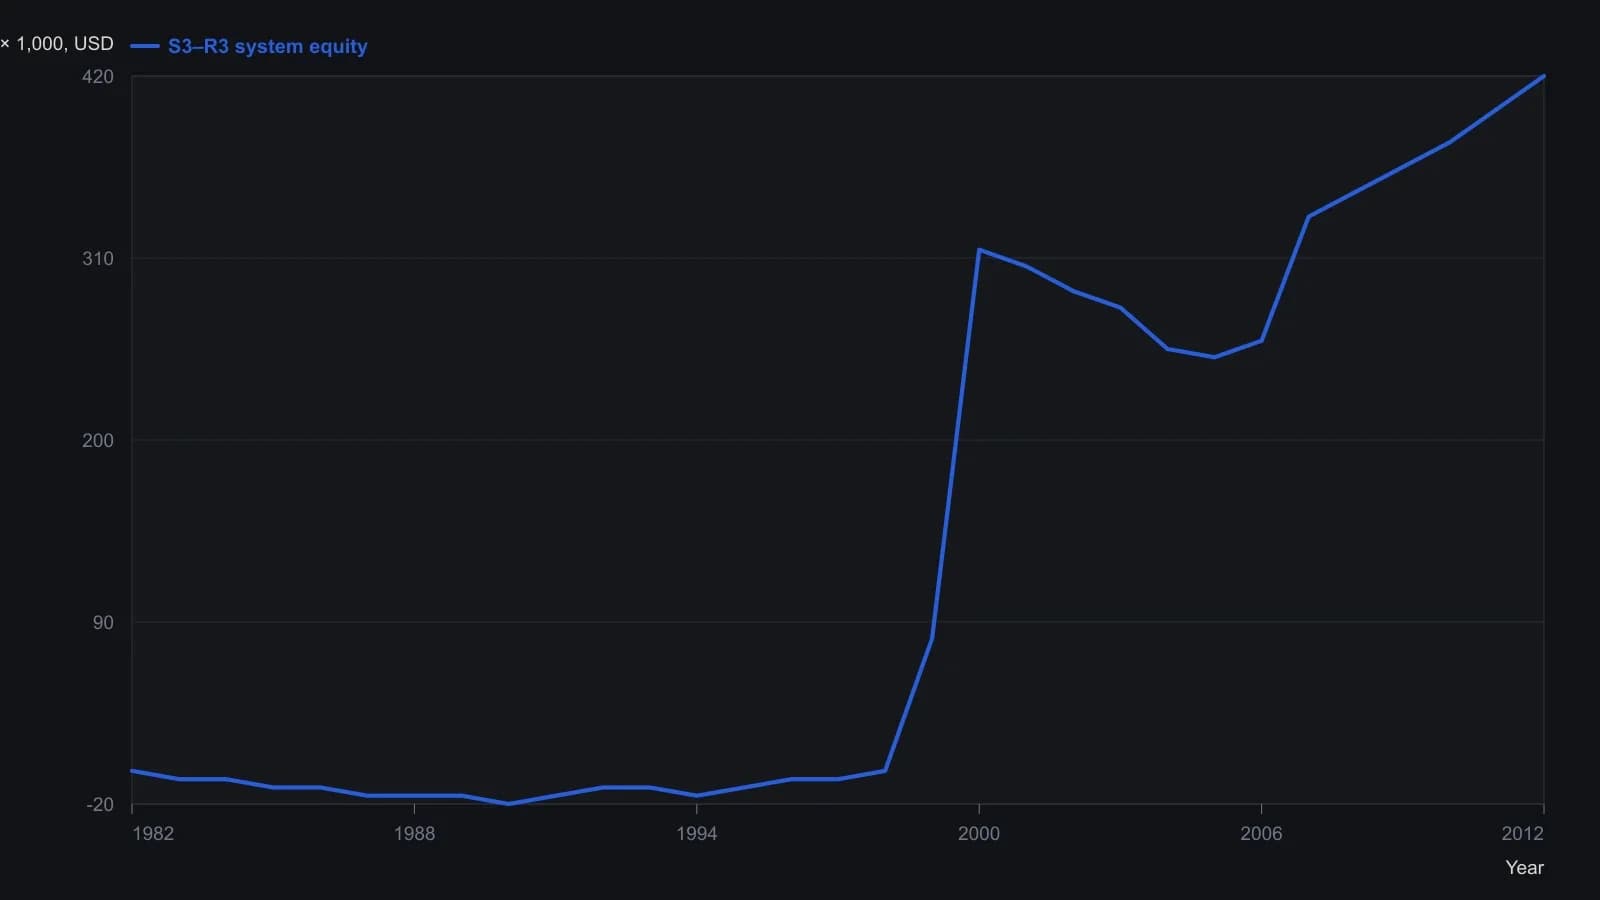
The coded test entered and exited at the next session open rather than on the article’s S3/R3 stops. Sample is one SP contract, Pinnacle Data, 1982–2013. The underwater-equity inset is omitted because its vertical scale cannot be read on the raster.
Window length and start point
Computed level values depend on both the selected time-frame length and the analysis start point. A different window or a different start point produces a different set of horizontal levels from the same construction.
All readings on this track · 38 readings
- 1988Constructing action-reaction lines from two pivots
- 1988Constructing intradaily point-and-figure boxes and pivot ladders
- 1991Constructing layered support and resistance from swings, pivots, and retracements
- 1994Three locks on a day-session order, then a staged exit
- 1994Building a five-level daily pivot grid
- 1996Constructing daily pivot points from session prices
- 1996Higher time frame balance points as a trend and band filter
- 1998Cup-with-handle construction rules
- 2000Pivot levels as a daily trade hypothesis
- 2001Construct a same-session polarity card around the daily pivot
- 2001Trading inside the cup-with-handle before the breakout
- 2005A lower-low rebound as one entry, abstention, and stop routine
- 2006Constructing session pivot maps from the prior high, low, and close
- 2006Constructing a pivot grid for stops and buy-stops
- 2006Monoparametric automatic trendline construction
- 2008Write the exit before the entry
- 2010Dynamic-pivot range grids for trend bias
- 2010Reverse-entry exits for pairs, pivots and support
- 2011Sequencing pairs, futures pivots, and implied volatility
- 2013Constructing Camarilla levels from prior range
- 2013Camarilla levels as a multi-timeframe map of reversion and breakout
- 2013Constructing a camarilla-grid from a completed lookback range
- 2013Constructing daily pivot support and resistance rungs
- 2014Constructing daily pivot levels from prior-session OHLC
- 2014Next-session pivot support and resistance from daily bars
- 2014Constructing session pivot rails from the prior-day range
- 2014Evaluating moving-average, pivot, and support-resistance filters
- 2016Stage a Trailing stop toward a planned target
- 2016Smoothed RSI and full-cut pivots for option-income exits
- 2017Constructing a weekly seasonality pivot scaffold
- 2017Seasonality and pivot points as scenario maps, not forecasts
- 2018Wave pivots, strength filters, and option premium
- 2018Constructing Fibonacci and daily pivot support maps
- 2018Building a daily pivot lattice with Fibonacci rails
- 2019Prior-session pivot channels for same-day entries
- 2019Constructing intraday pivot channels from prior-session levels
- 2020Variable-strength pivot highs as falsifiable entry filters
- 2020A high-volume-pivot long after a multi-week decline