2014issue C1243-48
Evaluating moving-average, pivot, and support-resistance filters
A moving-average evaluation should start from an explicit quantitative baseline and then compare that baseline with an out-of-sample result. Pivot-point and support-resistance rules become evaluable only when a repeatable OHLC chart condition is restated as a falsifiable trade hypothesis.
- A moving-average evaluation should start from an explicit quantitative baseline and then compare that baseline with an out-of-sample result.
- Pivot-point and support-resistance rules become evaluable only when a repeatable OHLC chart condition is restated as a falsifiable trade hypothesis.
- A published model-portfolio window can be used as a teaching record of day, swing, and mini-swing classifications, but it does not establish that those classifications will hold later.
- Evaluation compares an explicit quantitative or chart-based rule with an out-of-sample result instead of treating a published example as proof.
What evaluation means here
Evaluation means comparing an explicit quantitative or chart-based rule with an out-of-sample result instead of treating a published example as proof. Out-of-sample means a later period or unseen interval used to check whether a moving-average or chart-condition rule still behaves as claimed.
A moving average is a quantitative baseline that averages ordered price, volume, or breadth observations over a defined lookback and sampling interval so later results can be compared with an explicit forecast.
Start from an explicit baseline
A moving-average evaluation should start from an explicit quantitative baseline and then compare that baseline with an out-of-sample result. The baseline is the forecast you hold fixed before you look at the later interval.
The comparison is the test. If the later result is not set beside that baseline, the moving average has not been evaluated.
Trailing 3- and 6-month returns on the Global Markets ETF monitor
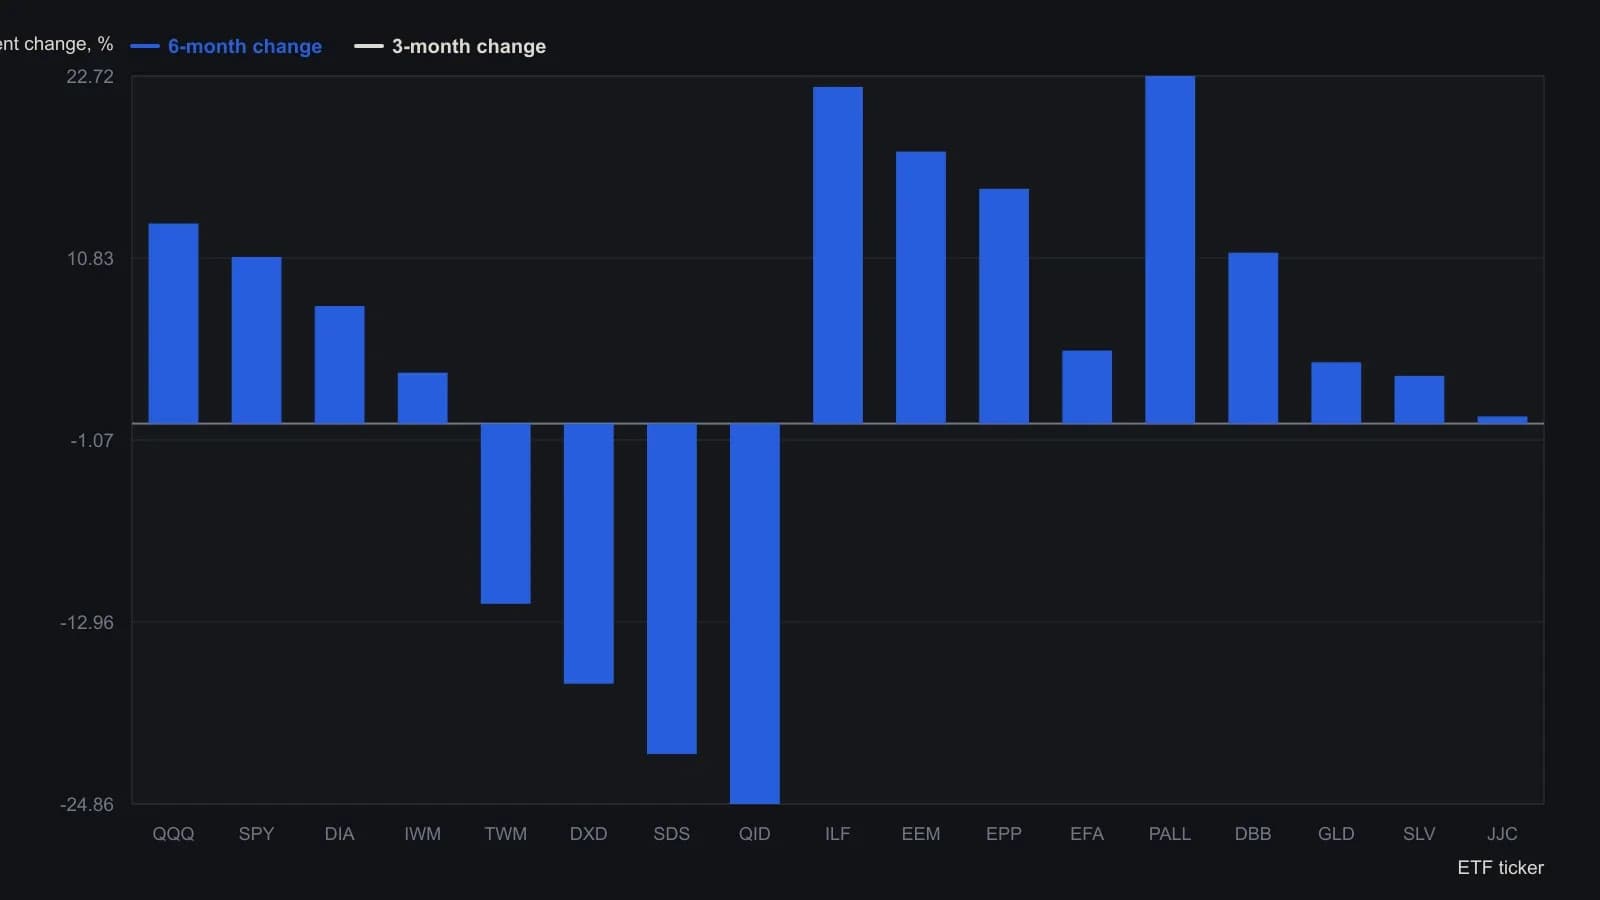
Phase tags on that date come from stacked 10/30/50/200 pivot moving averages. The percent changes are trailing lookbacks ending 8 August 2014, so they describe coincident history rather than a later out-of-sample test of the phase rule.
Restate chart conditions as hypotheses
A pivot point is a repeatable OHLC chart condition used to form a signal that can be stated as a testable trade hypothesis rather than a prediction of the future. Support and resistance is price structure on a chosen chart scale that marks where a hypothesis of holding or failing can be accepted or rejected.
Pivot-point and support-resistance rules become evaluable only when a repeatable OHLC chart condition is restated as a falsifiable trade hypothesis. Until the chart condition is isolated in that form, the rule cannot be checked against an out-of-sample result.
Read a model-portfolio as a teaching record
A model-portfolio is a disclosed set of open and closed trades used as a teaching record of how rules were applied, not as evidence of future results. A published model-portfolio window can be used as a teaching record of day, swing, and mini-swing classifications, but it does not establish that those classifications will hold later.
All readings on this track · 38 readings
- 1988Constructing action-reaction lines from two pivots
- 1988Constructing intradaily point-and-figure boxes and pivot ladders
- 1991Constructing layered support and resistance from swings, pivots, and retracements
- 1994Three locks on a day-session order, then a staged exit
- 1994Building a five-level daily pivot grid
- 1996Constructing daily pivot points from session prices
- 1996Higher time frame balance points as a trend and band filter
- 1998Cup-with-handle construction rules
- 2000Pivot levels as a daily trade hypothesis
- 2001Construct a same-session polarity card around the daily pivot
- 2001Trading inside the cup-with-handle before the breakout
- 2005A lower-low rebound as one entry, abstention, and stop routine
- 2006Constructing session pivot maps from the prior high, low, and close
- 2006Constructing a pivot grid for stops and buy-stops
- 2006Monoparametric automatic trendline construction
- 2008Write the exit before the entry
- 2010Dynamic-pivot range grids for trend bias
- 2010Reverse-entry exits for pairs, pivots and support
- 2011Sequencing pairs, futures pivots, and implied volatility
- 2013Constructing Camarilla levels from prior range
- 2013Camarilla levels as a multi-timeframe map of reversion and breakout
- 2013Constructing a camarilla-grid from a completed lookback range
- 2013Constructing daily pivot support and resistance rungs
- 2014Constructing daily pivot levels from prior-session OHLC
- 2014Next-session pivot support and resistance from daily bars
- 2014Constructing session pivot rails from the prior-day range
- 2014Evaluating moving-average, pivot, and support-resistance filters
- 2016Stage a Trailing stop toward a planned target
- 2016Smoothed RSI and full-cut pivots for option-income exits
- 2017Constructing a weekly seasonality pivot scaffold
- 2017Seasonality and pivot points as scenario maps, not forecasts
- 2018Wave pivots, strength filters, and option premium
- 2018Constructing Fibonacci and daily pivot support maps
- 2018Building a daily pivot lattice with Fibonacci rails
- 2019Prior-session pivot channels for same-day entries
- 2019Constructing intraday pivot channels from prior-session levels
- 2020Variable-strength pivot highs as falsifiable entry filters
- 2020A high-volume-pivot long after a multi-week decline