1994issue C051-11
Market life expectancy as a risk filter
A classified trend can be turned into historical extent and duration odds, then used to cap how much of the book may stay long before a trade is placed.
- A usable Risk-reward ratio starts with whether and how far to be long, using trend direction plus the odds that the current move continues versus reverses.
- Dow Theory classifies the primary trend, secondary reaction, and daily fluctuation so each swing's extent and duration can be measured.
- Classified historical swings form frequency distributions of extent and duration, so a live move can be treated as having a remaining life expectancy.
- Life-expectancy tables are a foundation for keeping odds, then weighted with other checks so an aged move is not squeezed late.
Start with how far to stay long
A usable Risk-reward ratio starts with whether and how far to be long, using trend direction plus the odds that the current move continues versus reverses.
Quantified entry and exit rules, independent of later rationalization, are built after the economic backdrop and the market's place in that backdrop are stated.
Classify the swing before measuring it
Dow Theory's three concurrent movements, the primary trend, the secondary reaction, and daily fluctuation, supply the classification used to measure each swing's extent and duration.
Classified historical swings show statistically usable frequency distributions of extent and duration, so a live move can be treated as having a remaining life expectancy.
A median-age book cap
As of the February 1992 snapshot, an 18-index average upswing of 18.6% over 74.4 days sat near median life: 53.5% of like swings were larger and 67.3% lasted longer, implying roughly a 40% chance the move would end soon and a suggested long cap near 60% of maximum stock exposure if that statistic were used alone.
When segment profiles invert the cap
Segment profiles can invert the same filter. OTC industrials at 41.7% over 215 days were in a thin historical tail, with only 14.2% of comparable swings larger and 26.5% longer, while the DJIA at 14.4% over 60 days still had most comparable swings larger and longer.
Exposure through an intermediate swing
The same age filter is meant to raise and cut exposure across an intermediate swing: fuller long early, lighter before a secondary reaction, flat or short in the reaction, then long again near its low.
Primary upswings that sat well past median extent and duration preceded several historical breaks, including 29.9% in 99 days before 29 October 1929, 26.9% in 96 days before Black Monday, and 24.4% in 200 days in October 1989.
Bull-market secondary correction extents, 1896–1991
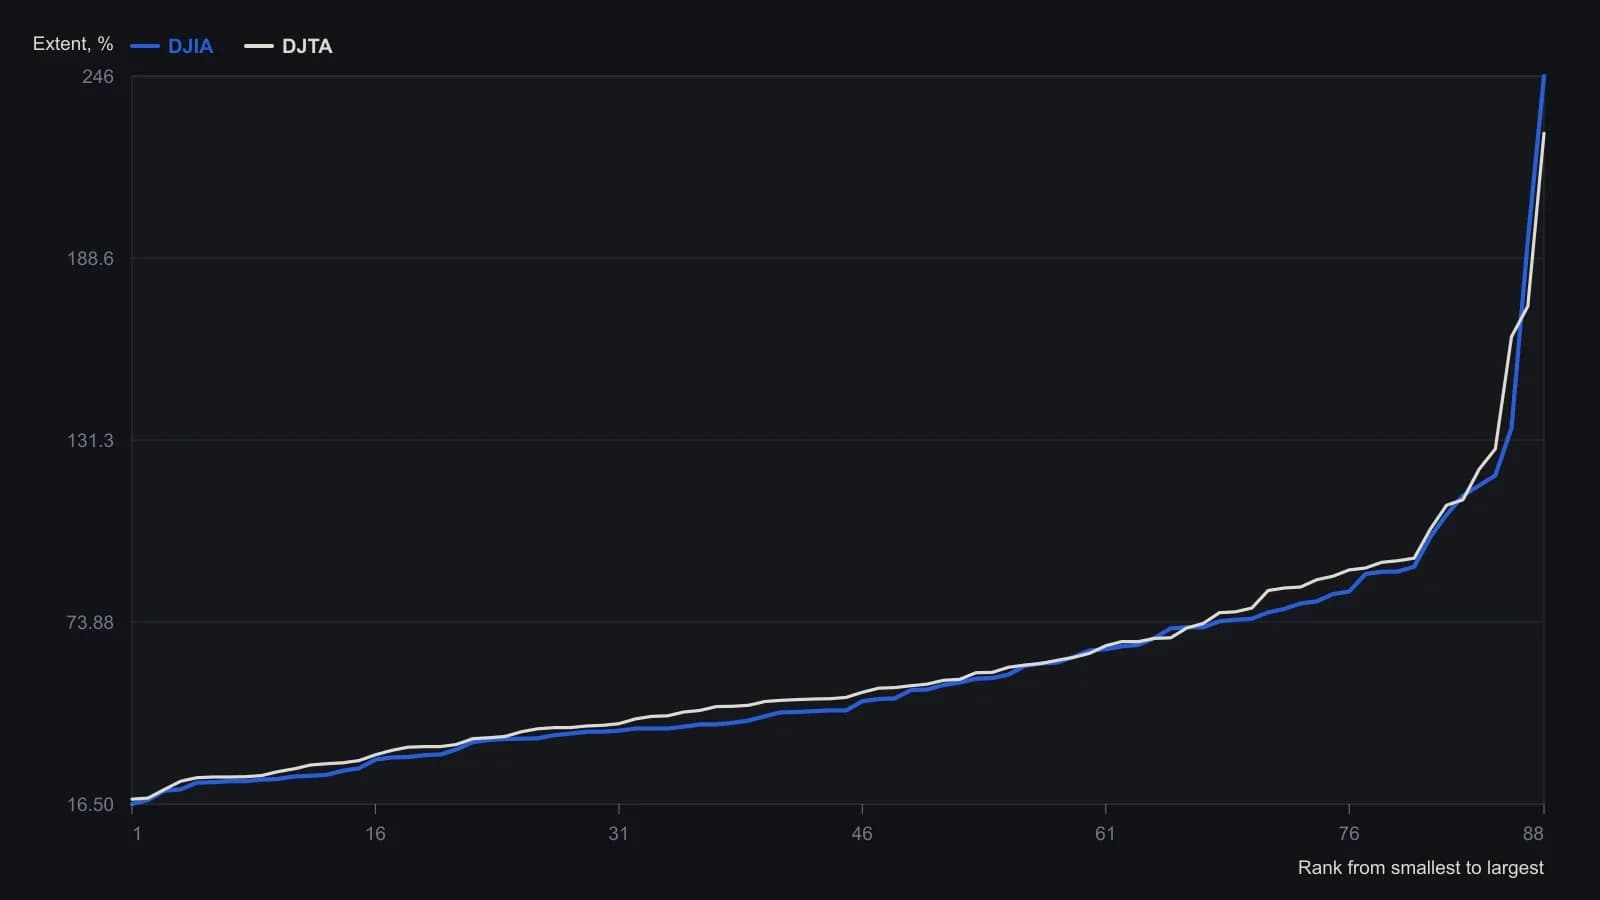
Sample is bull-market secondary corrections only, classified on the DJIA and DJTA. Sperandeo notes that 95 percent last more than 14 calendar days and 98 percent retrace at least 20 percent of the previous primary swing. Rows are sorted by size, not by date. A few OCR gaps in the print (18 0, 46 0, 41 3, l13.7, 120.l) were read as 18.0, 46.0, 41.3, 113.7 and 120.1 to keep the ranked sequence intact.
Keep the odds, then weight them
Life-expectancy tables are a foundation for keeping odds, not a guarantee. Remaining probabilities are then weighted with other fundamental and technical checks so late-stage squeezing of an aged move is avoided.
Editorial: Expected value is the later bound on that weighted remainder, so the table stays an exposure filter rather than a stand-alone call to stay long.
All readings on this track · 29 readings
- 1982A bounded-risk entry separates a forecast from a trend
- 1984Critiquing reward bias, single-scale charts, and exact-turn forecasts
- 1990Constructing dual-average primary-trend confirmation
- 1991Two-average confirmation before a primary reversal call
- 1991Delayed confirmation is not Dow Theory divergence
- 1991Confirmation delay and breadth divergence in a two-average case
- 1992Utilities as a rate-regime lead for equities
- 1992Critiquing unconfirmed Dow rallies with volume
- 1993When Dow Theory signals fail after the decision-makers change
- 1994Market life expectancy as a risk filter
- 1994Score industrial and transport sync before calling an intermediate-trend signal
- 1997A 1995 industrial-average breakout mapped from component trends
- 1998Confirm Dow trends with Market breadth and Head and shoulders
- 1999Confirming an equity idea with rate, commodity, and index spreads
- 2001Why trend, range, and Dow rules need separate tests
- 2001Bear-market confirmation via prior correction troughs
- 2002Constructing a Dow line before breakout confirmation
- 2002Two-average confirmation as a swing-by-swing classroom drill
- 2002Withhold the hypothesis until the second average confirms: a 2001 case
- 2002A primary-bear case study in cycle speed, Dow theory, and pattern legs
- 2003Four index proxies as a bear-regime dashboard
- 2004Dual-average confirmation at shared prior highs
- 2004Confirmation as the second clock on a trend break
- 2004The confirmation-reaction planning window after a joint break
- 2005Dow confirmation as a two-average trend test
- 2008Related-average confirmation lag after a correction
- 2008Intermediate confirmation outranks secular phasing
- 2012Align swings to nested energy regimes
- 2016From nonconfirmation to a bearish primary trend change