2002issue C101-4
A primary-bear case study in cycle speed, Dow theory, and pattern legs
This archive case study records a three-layer reading of a messy primary decline. Cycle-top speed tested whether the prior four-year-cycle low still held, Dow theory tested whether a rebound was only a secondary reaction, and monthly pattern geometry plus an Elliott-wave-style leg count assigned each price box to the current swing or to a later concluding swing.
- From 1896, five four-year cycles that peaked in 20 months or less each undercut the prior four-year-cycle low. The early-2000s cycle was timed at 16 months on the industrial average and 17 months on the 500-stock average, and by 16 July 2002 the 500-stock average had already traded through its 1998 cycle low at 952.
- Dow theory ranked three concurrent swings so a multi-year primary bull or bear was not confused with a secondary reaction lasting from three weeks to several months, or with daily fluctuation treated as noise.
- Monthly head-and-shoulders geometry supplied minimum measured-move boxes, while an Elliott-wave-style count kept nearer boxes on a second declining swing and reserved a deeper industrial-average zone near 3000 for a later concluding leg.
- After the then-forming four-year-cycle low, the working map was a neckline-test rally lasting under 20 months, classified as a secondary reaction and a short four-year-cycle advance, not a new primary bull.
A messy primary decline, read in three layers
This article is a TradersWeek editorial walk-through of one archive case study. The archive recorded a historical workflow. It did not publish a trading system.
The editorial exam uses three layers. Cycle-top speed tests whether the prior four-year-cycle low is still a valid floor. Dow-theory rank tests whether a rebound is only a secondary reaction. Monthly head-and-shoulders geometry, plus an Elliott-wave-style count of declining legs, assigns each price box to the current swing or to a later concluding swing.
Cycle-top speed and the prior floor
A four-year-cycle is a recurring multi-year swing. Its peak speed and its low-to-low sequence are used to judge whether a prior cycle low should still hold.
The cycle-top-speed-rule is the historical check that a four-year cycle peaking in 20 months or less has undercut the prior four-year-cycle low. From 1896, five four-year cycles that peaked in 20 months or less each undercut the prior four-year-cycle low.
The early-2000s cycle was timed at 16 months on the industrial average and 17 months on the 500-stock average. Both readings sat inside that 20-month speed window.
The 1998 cycle lows were already in question
The 1998 four-year-cycle lows stood at 7615 on the industrial average and 952 on the 500-stock average. By 16 July 2002 the 500-stock average had already traded through that 952 level.
TradersWeek editorial reading: the July 2002 trade through 952 is the concrete instance of the speed rule on the 500-stock average. The archive listed the industrial print at 7615 as the matching 1998 cycle low. It did not, in the approved record, state that the industrial average had already broken that level.
Dow theory ranks the rebound, not the headline
Dow theory in this case study ranked three concurrent swings: a multi-year primary bull or bear, a counter-trend secondary reaction typically lasting from three weeks to several months, and a daily fluctuation treated as noise.
A secondary-reaction is a sharp counter-trend rally or decline lasting from a few weeks to several months that does not, by itself, reverse the primary-trend. The rank is there so a multi-year primary bull or bear is not confused with that reaction or with day-to-day noise.
Primary trend built from four-year cycles
The primary-trend is the long bull or bear movement that can run for years. In this case study it is built from a series of four-year cycles.
Secular advances were counted as strings of four-year cycles: two in 1921-1929, six in 1942-1966, and seven in 1974-2000. The 1966-1974 primary decline was counted as two cycles.
How long a primary bear had lasted after a long bull
Two historical primary bears lasted about 37.5 percent and 33.3 percent as long as the preceding bulls. Applied to a 26-year 1974-2000 advance, those ratios pointed to calendar windows near 2008 and 2010, with four-year-cycle-low candidates in 2006 or 2010.
TradersWeek editorial reading: those windows are archive duration ratios. They are not a clock that must expire in a given year.
Monthly head-and-shoulders as a price hypothesis
Several monthly major-average charts were read as large head-and-shoulders patterns starting at the 1998 four-year-cycle low. Minimum measured-move objectives were 166, 305, 3006, 122, and 314 on the respective listed averages. The industrial average was recorded as not showing the same pattern.
A head-and-shoulders is a monthly reversal structure whose neckline height is projected as a minimum measured-move box. A measured-move is that minimum downside distance, taken from the height of the pattern and applied below the neckline. The archive used the box as a price hypothesis rather than a forecast of outcome.
Monthly S&P 500 and the 1998 cycle-low neckline
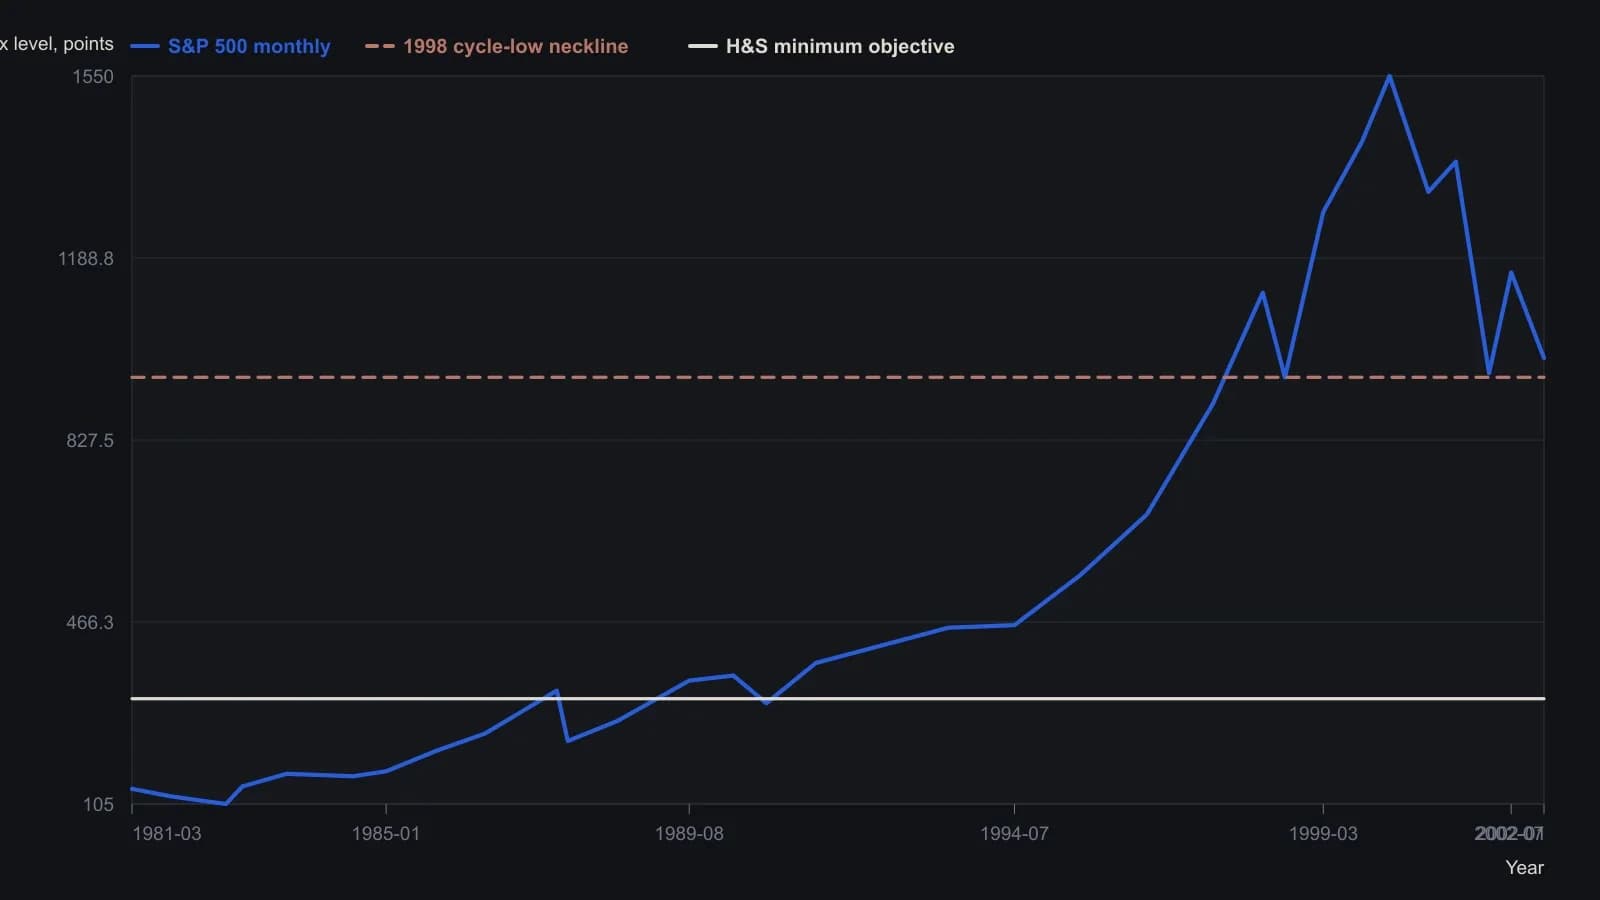
Price path digitized from the printed monthly candlesticks; intra-year timing is approximate and y-values are rounded to the resolution of the raster. The 952 neckline is the article’s stated 1998 four-year-cycle low. The 314 line is its stated minimum head-and-shoulders objective. Chart header quote on the last bar: 1066.50 / 1071.00 / 945.80 / 990.10.
Give-back boxes on the long advance
A 47 percent give-back of the 1974-2000 advance implied about 864 on the 500-stock average and 6495 on the industrial average. Four-year cycles that had already broken a prior cycle low were summarized as averaging a 46 percent give-back of the prior cycle advance.
Elliott-style legs assign the boxes
Elliott-wave analysis, in this case study, is a count of successive declining legs that keeps nearer measured-move boxes on an early swing and reserves a deeper box for a later concluding bear-market leg.
Nearer measured-move and retracement boxes were assigned to a second declining swing. A later third concluding bear-market leg was the Elliott-wave-style slot reserved for a deeper industrial-average zone near 3000 if the monthly patterns completed their minimum projections.
The rally after the forming cycle low
After the then-forming four-year-cycle low, the working map was a neckline-test rally lasting under 20 months, possibly near six months. That rally was classified as a Dow-theory secondary reaction and a short four-year-cycle advance, not a new primary bull.
All readings on this track · 29 readings
- 1982A bounded-risk entry separates a forecast from a trend
- 1984Critiquing reward bias, single-scale charts, and exact-turn forecasts
- 1990Constructing dual-average primary-trend confirmation
- 1991Two-average confirmation before a primary reversal call
- 1991Delayed confirmation is not Dow Theory divergence
- 1991Confirmation delay and breadth divergence in a two-average case
- 1992Utilities as a rate-regime lead for equities
- 1992Critiquing unconfirmed Dow rallies with volume
- 1993When Dow Theory signals fail after the decision-makers change
- 1994Market life expectancy as a risk filter
- 1994Score industrial and transport sync before calling an intermediate-trend signal
- 1997A 1995 industrial-average breakout mapped from component trends
- 1998Confirm Dow trends with Market breadth and Head and shoulders
- 1999Confirming an equity idea with rate, commodity, and index spreads
- 2001Why trend, range, and Dow rules need separate tests
- 2001Bear-market confirmation via prior correction troughs
- 2002Constructing a Dow line before breakout confirmation
- 2002Two-average confirmation as a swing-by-swing classroom drill
- 2002Withhold the hypothesis until the second average confirms: a 2001 case
- 2002A primary-bear case study in cycle speed, Dow theory, and pattern legs
- 2003Four index proxies as a bear-regime dashboard
- 2004Dual-average confirmation at shared prior highs
- 2004Confirmation as the second clock on a trend break
- 2004The confirmation-reaction planning window after a joint break
- 2005Dow confirmation as a two-average trend test
- 2008Related-average confirmation lag after a correction
- 2008Intermediate confirmation outranks secular phasing
- 2012Align swings to nested energy regimes
- 2016From nonconfirmation to a bearish primary trend change