1999issue C031-2
Confirming an equity idea with rate, commodity, and index spreads
A weekly confirmation lattice reads one equity idea against the Dow Theory pair, a Treasury bond rate proxy, the commodity-bond link, and a relative-strength spread. Shared trends leave the local signal in a coherent regime; splits are treated as a reason to downgrade it.
- Intermarket analysis places a single equity idea inside a weekly lattice of related price paths: the Dow Theory pair, a bond-futures rate proxy, commodity inflation pressure, and a peer or sector spread.
- A shared run of higher highs in the industrial and transportation averages is treated as confirmation that the equity backdrop is intact. A divergence is a warning of possible trend trouble, not proof of an immediate reversal.
- Rising bond-futures prices are read as falling yields and as equity support. Falling commodities are read as contained inflation that tends to support bonds; rising commodities are read as pressure on bond prices.
- Relative-strength spreads and group confirmation show whether a peer index or a related commodity group is still making the same sequence of highs and lows as the local idea.
Reading one equity idea in related markets
Intermarket analysis compares one market’s price path with another’s, including by viewing two charts together. Editorial framing: around a single equity idea, that comparison is organized as a weekly confirmation lattice. The lattice is the industrial versus transport trend, the bond-price rate backdrop, commodity inflation pressure, and a peer or sector spread.
The Dow Theory pair
When both the industrial and transportation averages are making higher highs, that shared trend is treated as confirmation that the equity backdrop is intact. The two series form the Dow Theory pair. If one of those averages prints a new high and the other does not, the split is a divergence. It is framed as a warning of possible trend trouble, not as proof of an immediate reversal, because the pair can realign later. In July 1998 the industrial average made a new high while the transportation average failed to confirm, and that divergence was presented as a forewarning of a later downtrend.
The rate proxy and the commodity-bond link
A rising-rate setting is treated as negative for equities and a falling-rate setting as supportive. Treasury bond futures are used as the rate proxy because their prices move opposite yield. Bond futures had been in an uptrend for more than a year, peaked in October 1998, then moved sideways while the stock market kept rising, which was read as a still-supportive stable-rate backdrop.
Falling commodity prices are treated as a sign of low inflation pressure that can support a bond rally, while rising commodity prices are treated as an inflation concern that tends to push bond prices lower. That pairing is the commodity-bond link.
Relative-strength spreads and group confirmation
A relative-strength spread is a side-by-side comparison of two equity indexes or sectors to see which path is still making higher highs and higher lows. During December 1998 the S&P 500 consolidated in a slight downward pattern while NASDAQ continued to print higher highs and higher lows, used as an example of superior NASDAQ relative strength. On weekly charts, a cyclical index peaked in July 1998 and had not made a new high in 1999, while a retail index had, illustrating sector-pair selection by relative trend.
Group confirmation checks whether a stock group is tracking the same sequence of highs and lows as the related commodity. After a fourth-quarter rally, gold traded a sequence of lower highs and lower lows and the gold-stock index followed the same path, used to confirm that group’s relative weakness versus the broader equity market. These cross-market links are not static and reward historical review.
Dow industrials make a July 1998 high the transports do not confirm
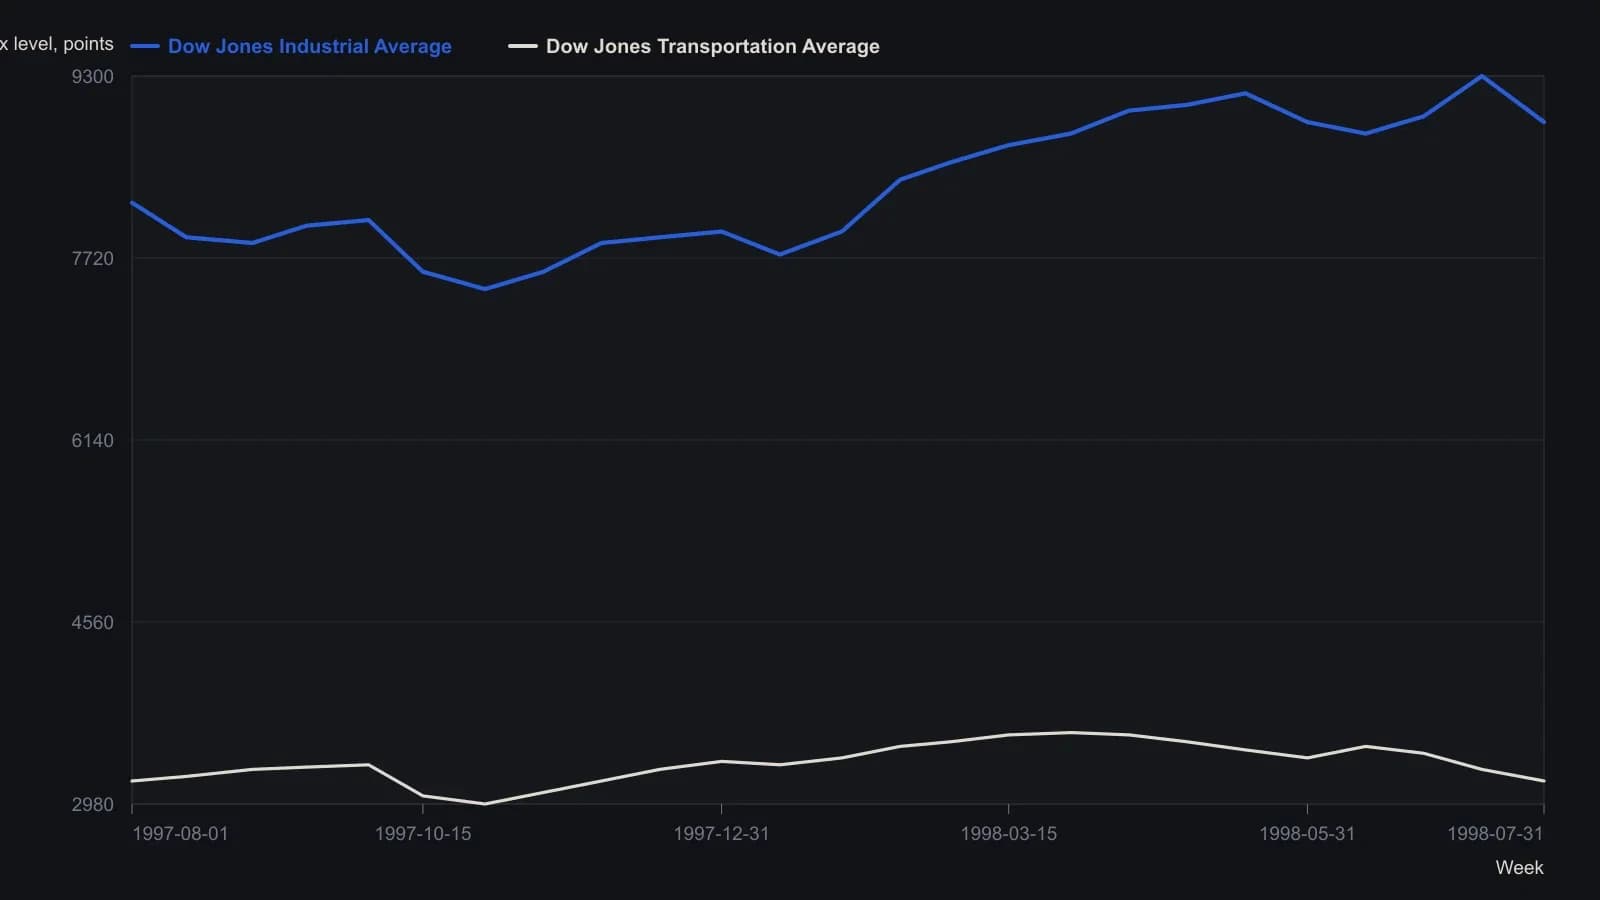
CQG prints both averages with an extra trailing zero (90000 for a 9000 industrials print). Points are weekly closes taken off the candles and restated in conventional index points. Raster resolution will not support tick-level precision.
All readings on this track · 29 readings
- 1982A bounded-risk entry separates a forecast from a trend
- 1984Critiquing reward bias, single-scale charts, and exact-turn forecasts
- 1990Constructing dual-average primary-trend confirmation
- 1991Two-average confirmation before a primary reversal call
- 1991Delayed confirmation is not Dow Theory divergence
- 1991Confirmation delay and breadth divergence in a two-average case
- 1992Utilities as a rate-regime lead for equities
- 1992Critiquing unconfirmed Dow rallies with volume
- 1993When Dow Theory signals fail after the decision-makers change
- 1994Market life expectancy as a risk filter
- 1994Score industrial and transport sync before calling an intermediate-trend signal
- 1997A 1995 industrial-average breakout mapped from component trends
- 1998Confirm Dow trends with Market breadth and Head and shoulders
- 1999Confirming an equity idea with rate, commodity, and index spreads
- 2001Why trend, range, and Dow rules need separate tests
- 2001Bear-market confirmation via prior correction troughs
- 2002Constructing a Dow line before breakout confirmation
- 2002Two-average confirmation as a swing-by-swing classroom drill
- 2002Withhold the hypothesis until the second average confirms: a 2001 case
- 2002A primary-bear case study in cycle speed, Dow theory, and pattern legs
- 2003Four index proxies as a bear-regime dashboard
- 2004Dual-average confirmation at shared prior highs
- 2004Confirmation as the second clock on a trend break
- 2004The confirmation-reaction planning window after a joint break
- 2005Dow confirmation as a two-average trend test
- 2008Related-average confirmation lag after a correction
- 2008Intermediate confirmation outranks secular phasing
- 2012Align swings to nested energy regimes
- 2016From nonconfirmation to a bearish primary trend change