2008issue C021-4
Related-average confirmation lag after a correction
A two-average chart is read in order: mark the primary trend and the secondary-correction extremes, treat a shared positive MACD-histogram divergence only as fading downside momentum, and withhold a trend call until the lagging average closes back through its correction high.
- Confirmation is both related averages advancing together or declining together, treated as aligned and usable information. One average rising while the other falls is not a directional signal.
- Nonconfirmation is a caution that the split will later resolve into confirmation. The split itself does not show whether that later confirmation will resume the prior trend or reverse it.
- A large positive MACD-histogram divergence after a sharp decline is read as fading downside momentum, even when one average's later bounce stays much weaker than the other.
- TradersWeek editorial reading: mark the primary trend and the correction extremes first, then wait for the lagging average to close back through its correction high. A follow-through failure leaves confirmation unfinished.
Two averages, one sequence
When two related averages advance together or decline together, that alignment is treated as confirmation and as information that can be acted on. A split in which one average rises while the other falls is not treated as a directional signal.
TradersWeek editorial reading treats the archive snapshot as a sequencing classroom rather than a finished market call. The work is to keep confirmation, nonconfirmation, and a shared positive MACD-histogram divergence in a fixed order so a split stays an open hypothesis.
Mark the primary trend first
A primary trend is the broad bull or bear movement lasting at least several months. Secondary corrections interrupt it and have been described as lasting from three weeks to several months while often retracing 33% to 66% of the prior primary swing.
A secondary correction stays classified as a correction, not a new primary trend, until price closes below the correction low in a bull market or above the reaction high in a bear market. The high of a bull-market correction, or the low of a bear-market reaction, is the correction extreme. A close beyond that level is what recasts the swing as finished.
A split is caution, not direction
A nonconfirmation between the two averages is a reason for caution because the split will later resolve into confirmation. The split itself does not show whether that later confirmation will resume the prior trend or reverse it.
The two averages do not need to move in lockstep to confirm. Confirmation can arrive days or weeks after one average has already reached a milestone.
The industrial and transport snapshot
After the July to August 2007 decline, both the industrials and the transports printed bullish positive divergences. The industrials then rallied to test highs near 14,000 while the transports bounce stayed muted.
On a closing basis the transports printed their first higher high only days before the snapshot, after the industrials had already done so in August. The transports remained below their 50-day exponential moving average after the industrials had closed above that average on September 13.
At the snapshot the transports had not broken the low of the prior significant correction from summer 2006, a decline of about 17%. Mid-August included a hammer that was read as leftover demand near the yearly lows rather than a new wave of selling.
Read the histogram as a fade
A large positive MACD-histogram divergence after a sharp decline is read as a sign that downside momentum has faded, even when the later bounce is much weaker in one average than in the other.
Positive MACD-histogram divergence means price making a lower low while the MACD histogram does not. That reading is fading downside momentum rather than a complete trend reversal.
Wait for the lagging close
TradersWeek editorial reading withholds a trend call while the lagging average has not closed back through its correction high. The transports remaining below their 50-day exponential moving average, after the industrials had already closed above that average, leaves that nearby barrier unmet.
A bounce that cannot hold a close above a correction high or a nearby moving-average barrier is a follow-through failure. It leaves confirmation unfinished.
Transports still sit under the correction high
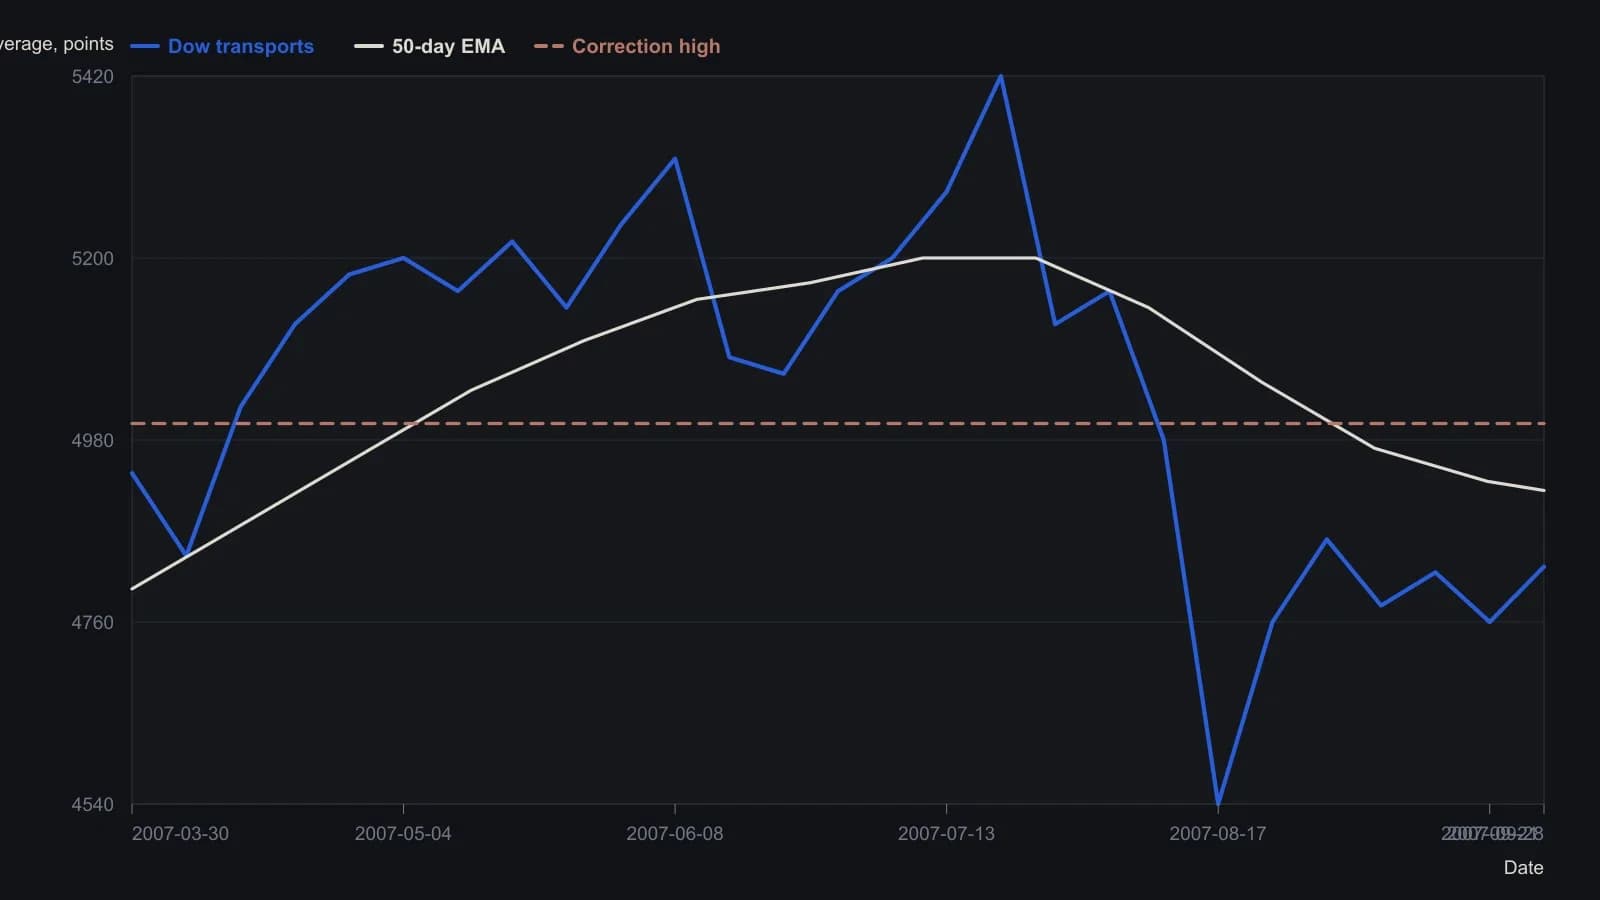
Closes are visual weekly readings from the daily candlestick pane (Prophet Financial, spring–autumn 2007); y-values are rounded to about 20 points, the resolution the raster will support. The 5000 threshold is the resistance drawn at the correction high on the companion two-year transport chart. Last official header prints are 4827.36 for the average and 4919.45 for the 50-day EMA.
All readings on this track · 29 readings
- 1982A bounded-risk entry separates a forecast from a trend
- 1984Critiquing reward bias, single-scale charts, and exact-turn forecasts
- 1990Constructing dual-average primary-trend confirmation
- 1991Two-average confirmation before a primary reversal call
- 1991Delayed confirmation is not Dow Theory divergence
- 1991Confirmation delay and breadth divergence in a two-average case
- 1992Utilities as a rate-regime lead for equities
- 1992Critiquing unconfirmed Dow rallies with volume
- 1993When Dow Theory signals fail after the decision-makers change
- 1994Market life expectancy as a risk filter
- 1994Score industrial and transport sync before calling an intermediate-trend signal
- 1997A 1995 industrial-average breakout mapped from component trends
- 1998Confirm Dow trends with Market breadth and Head and shoulders
- 1999Confirming an equity idea with rate, commodity, and index spreads
- 2001Why trend, range, and Dow rules need separate tests
- 2001Bear-market confirmation via prior correction troughs
- 2002Constructing a Dow line before breakout confirmation
- 2002Two-average confirmation as a swing-by-swing classroom drill
- 2002Withhold the hypothesis until the second average confirms: a 2001 case
- 2002A primary-bear case study in cycle speed, Dow theory, and pattern legs
- 2003Four index proxies as a bear-regime dashboard
- 2004Dual-average confirmation at shared prior highs
- 2004Confirmation as the second clock on a trend break
- 2004The confirmation-reaction planning window after a joint break
- 2005Dow confirmation as a two-average trend test
- 2008Related-average confirmation lag after a correction
- 2008Intermediate confirmation outranks secular phasing
- 2012Align swings to nested energy regimes
- 2016From nonconfirmation to a bearish primary trend change