2012issue C0518-25
Align swings to nested energy regimes
Oscillator signals can stay saturated through long one-way swings. Classify whether parent frames are still coiling, still releasing, or already spent, then take direction from nested higher highs and higher lows.
- Oscillator and momentum-crossover signals can stay saturated through long one-way swings, and a higher price high against a lower indicator high is not a nearby-reversal cue when restoring pullbacks keep printing that pattern.
- Market-regime-classification sorts each frame in the factor-of-five stack as coiling, trending, or spent so one trade sits inside a larger stored-energy context.
- Energy on a slower frame is treated as about five times stronger than the next faster frame, so a daily long on a pullback can fight a weekly swing.
- Dow-theory direction comes from nested higher highs and higher lows, and reversals are read from the inside out as 78-minute structure turns before the daily frame follows.
Saturated oscillators are not completed swings
Oscillator and momentum-crossover signals can stay saturated through long one-way swings. In choppy stretches, a longer-horizon relative-strength reading can remain between 30 and 70 for months.
A higher price high against a lower indicator high is not a reliable nearby-reversal cue when extended swings keep producing restoring-pullback action. A restoring-pullback is a counterswing that reloads a still-intact larger trend and can print a false oscillator divergence while the parent swing continues, automatically placing a lower high on the oscillator.
Classify coil, release, or spent energy
Price can be classified as either storing potential energy in a consolidation coil or releasing it as trend motion. Stored-energy is the potential built during that coil and later released as directional travel on the same time frame. A longer coil is described as storing more energy for the next release.
Market-regime-classification sorts each nested time frame as coiling, trending, or spent so a single trade sits inside a larger energy context rather than being judged alone.
Read swings inside the factor-of-five stack
Elliott-wave reading treats price as motive swings made of five nested waves, so a slower pattern is expected to contain the next faster set of waves. Nested five-wave motive structure implies that larger patterns contain smaller ones.
A factor-of-five-stack anchors on monthly bars, then weekly, daily, and 78-minute bars, each roughly five times faster than the frame above it. That ladder is used to read swings inside swings.
Energy attributed to a slower frame is treated as about five times stronger than the next faster frame, so a daily long taken on a pullback can actually be fighting a weekly swing.
Use the same choppiness reading on every frame
A choppiness-reading is a 14-bar range-versus-path gauge scaled from 0 to 100. It rises when price is trendless and falls when price is traveling. Trendless action is tagged near 61.8 and trending action at 38.2 or lower, so a rise toward 61.8 marks a tight coil and a drop below 38.2 raises the chance of a later pause.
The same choppiness-reading applied across the nested stack classifies regime. High monthly and weekly values can support a large emerging trend, while a spent daily or 78-minute reading implies those faster frames need a pullback or sideways recovery first.
Take direction from nested swing structure
Dow-theory uses sequences of higher highs and higher lows, or the reverse, on fractal frames to set direction. Direction is taken from those sequences on the nested frames.
Reversals are described as starting from the inside out, so that 78-minute swing structure turns before the daily frame follows. Reversals are treated as beginning on the fastest structure first.
S&P 500 choppiness across nested timeframes
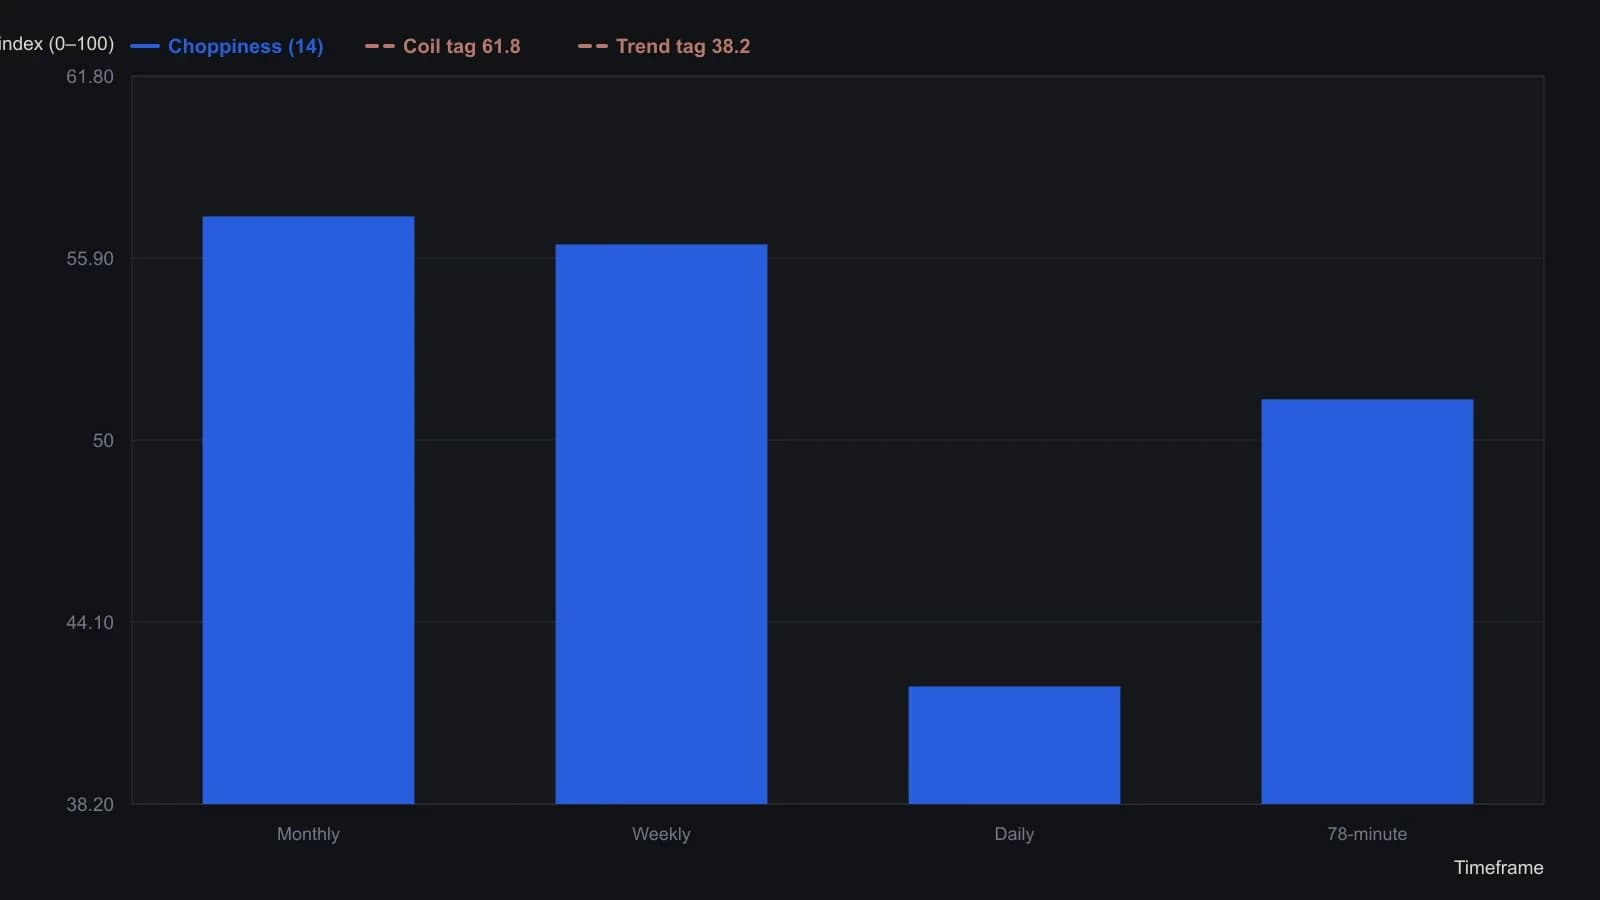
Choppiness length is 14 on every frame, the Fe(14) setting printed on the pane. Coil and trend tags are the 61.8 and 38.2 Fibonacci levels used in the article.
All readings on this track · 29 readings
- 1982A bounded-risk entry separates a forecast from a trend
- 1984Critiquing reward bias, single-scale charts, and exact-turn forecasts
- 1990Constructing dual-average primary-trend confirmation
- 1991Two-average confirmation before a primary reversal call
- 1991Delayed confirmation is not Dow Theory divergence
- 1991Confirmation delay and breadth divergence in a two-average case
- 1992Utilities as a rate-regime lead for equities
- 1992Critiquing unconfirmed Dow rallies with volume
- 1993When Dow Theory signals fail after the decision-makers change
- 1994Market life expectancy as a risk filter
- 1994Score industrial and transport sync before calling an intermediate-trend signal
- 1997A 1995 industrial-average breakout mapped from component trends
- 1998Confirm Dow trends with Market breadth and Head and shoulders
- 1999Confirming an equity idea with rate, commodity, and index spreads
- 2001Why trend, range, and Dow rules need separate tests
- 2001Bear-market confirmation via prior correction troughs
- 2002Constructing a Dow line before breakout confirmation
- 2002Two-average confirmation as a swing-by-swing classroom drill
- 2002Withhold the hypothesis until the second average confirms: a 2001 case
- 2002A primary-bear case study in cycle speed, Dow theory, and pattern legs
- 2003Four index proxies as a bear-regime dashboard
- 2004Dual-average confirmation at shared prior highs
- 2004Confirmation as the second clock on a trend break
- 2004The confirmation-reaction planning window after a joint break
- 2005Dow confirmation as a two-average trend test
- 2008Related-average confirmation lag after a correction
- 2008Intermediate confirmation outranks secular phasing
- 2012Align swings to nested energy regimes
- 2016From nonconfirmation to a bearish primary trend change