2001issue C121-3
Bear-market confirmation via prior correction troughs
A 25 to 35 percent drop from a peak is only a percentage-bear threshold. Bear-market confirmation still waits on a downside support break of the last-bull-market correction, so a fast selloff is not treated as a completed regime change until prior-trough support fails.
- Bear-market confirmation is a major decline that falls below the trough of the previous major bull-market correction, not a percentage label on its own.
- The S&P Transportation Index reached the 25 to 35 percent percentage-bear threshold in early fall 1999, then broke its 1998 last-bull-market correction only in December 1999.
- Related-average confirmation is used when two troughs compete: the transports confirmed the larger 1998 S&P 500 correction and did not confirm the smaller 1999 one.
- If the 1998 S&P correction low near 972 is the operative prior-trough support, a later low of 1092 stayed about 10 percent above that trough and above both the median-decline marker and the extreme-decline marker.
What counts as bear-market confirmation
In this framework, a bear-market confirmation is a major decline that falls below the trough of the previous major bull-market correction. That last-bull-market correction is the final significant pullback before a bull-market peak, later used as the reference trough.
Prior correction troughs are treated as prior-trough support. A break of that support during an already steep decline is a downside support break and is read as a completed move into bearish territory.
A 25 percent to 35 percent drop from a peak is commonly used as a percentage-bear threshold to label a bear market. That label can be applied without a lower low versus the last-bull-market correction.
How the transports confirmed
The S&P Transportation Index peaked at 835 in spring 1999 after a deep correction from early summer 1998 through year-end. That 1998 low later served as the last-bull-market correction reference trough.
The transports reached the 25 percent to 35 percent band in early fall 1999 without yet making a lower low versus the 1998 correction trough. After a brief rally, the index resumed lower and broke that last-bull-market correction low in December 1999, then fell about another 10 percent before a spring 2000 rebound.
In the transport case, a low formed about one month after the confirmation break and that level was not successfully retested for eight months.
Two candidate troughs on the S&P 500
The S&P 500 peaked near 1550 in spring 2000, leaving two candidate last-bull-market corrections: a larger 1998 decline confirmed by the transports and a smaller 1999 decline that was not. Related-average confirmation is the check that a related average validates the same rally or breakdown before a candidate trough is accepted.
If the smaller 1999 S&P correction is treated as the last-bull-market correction trough, confirmation sits near 1247 at year-end 2000, after which the index declined about another 12 percent.
If the 1998 S&P correction low near 972 is the operative long-term prior-trough support, a later low of 1092 remained about 10 percent above that trough. The index was still above both a 30 percent median-decline marker and a 47 percent extreme-decline marker.
S&P 500 versus two candidate bull-market correction troughs
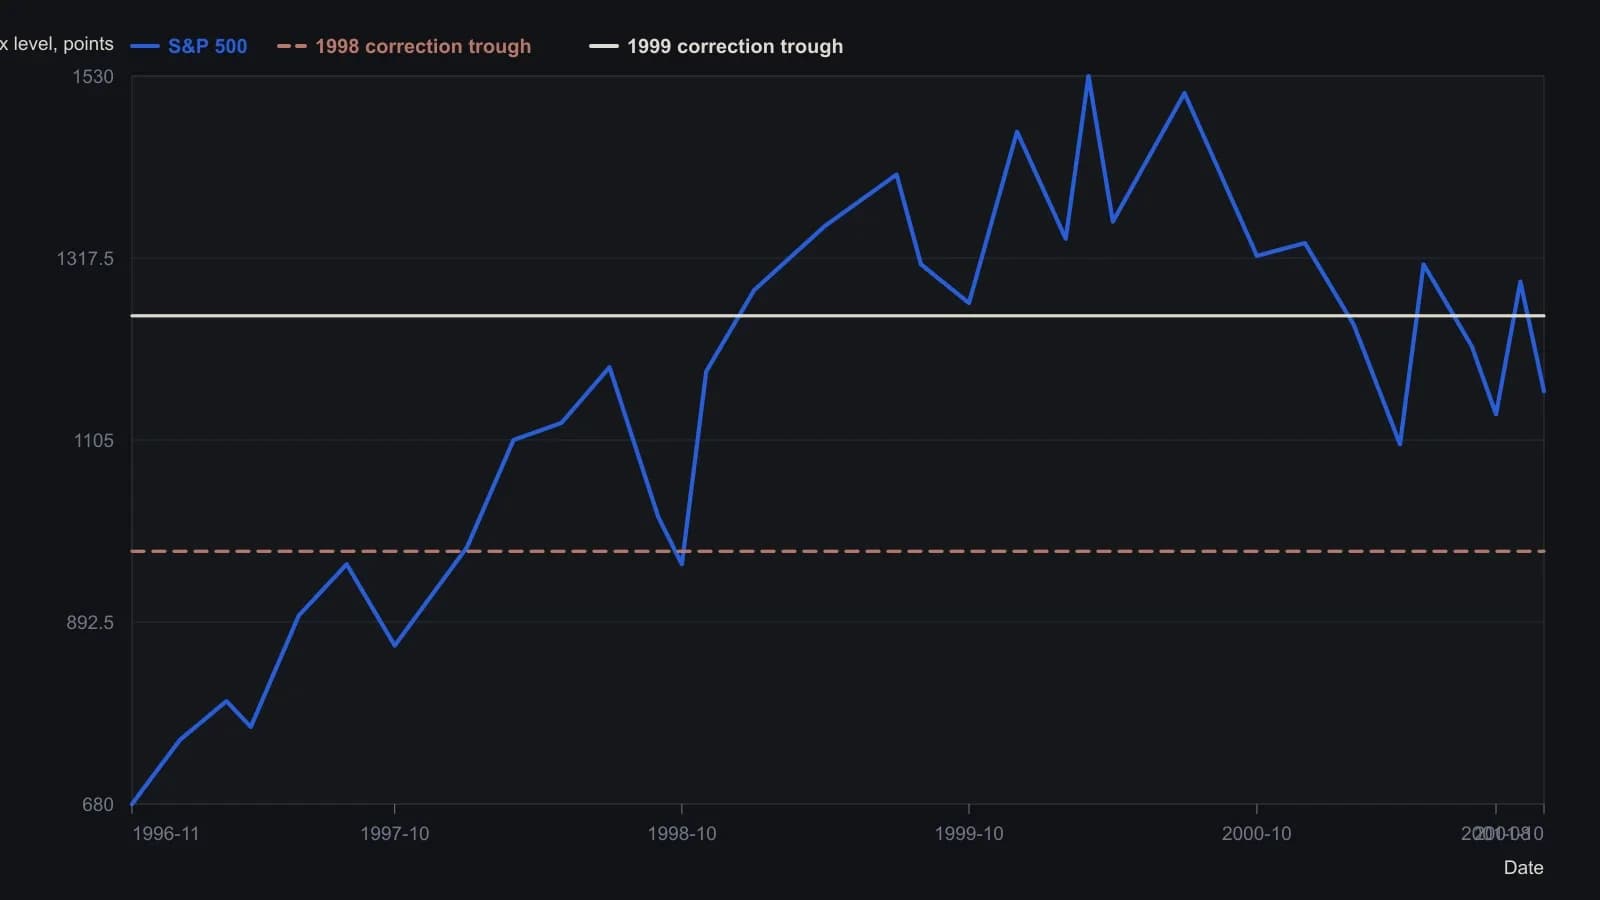
Digitized from the raster against the printed 600–1600 scale (50-point grid). Placement error is about ±10 index points. The last print, 1,161.97, is taken from the chart-window header. The two horizontals are the support lines drawn on the source chart, not calculated retracements.
All readings on this track · 29 readings
- 1982A bounded-risk entry separates a forecast from a trend
- 1984Critiquing reward bias, single-scale charts, and exact-turn forecasts
- 1990Constructing dual-average primary-trend confirmation
- 1991Two-average confirmation before a primary reversal call
- 1991Delayed confirmation is not Dow Theory divergence
- 1991Confirmation delay and breadth divergence in a two-average case
- 1992Utilities as a rate-regime lead for equities
- 1992Critiquing unconfirmed Dow rallies with volume
- 1993When Dow Theory signals fail after the decision-makers change
- 1994Market life expectancy as a risk filter
- 1994Score industrial and transport sync before calling an intermediate-trend signal
- 1997A 1995 industrial-average breakout mapped from component trends
- 1998Confirm Dow trends with Market breadth and Head and shoulders
- 1999Confirming an equity idea with rate, commodity, and index spreads
- 2001Why trend, range, and Dow rules need separate tests
- 2001Bear-market confirmation via prior correction troughs
- 2002Constructing a Dow line before breakout confirmation
- 2002Two-average confirmation as a swing-by-swing classroom drill
- 2002Withhold the hypothesis until the second average confirms: a 2001 case
- 2002A primary-bear case study in cycle speed, Dow theory, and pattern legs
- 2003Four index proxies as a bear-regime dashboard
- 2004Dual-average confirmation at shared prior highs
- 2004Confirmation as the second clock on a trend break
- 2004The confirmation-reaction planning window after a joint break
- 2005Dow confirmation as a two-average trend test
- 2008Related-average confirmation lag after a correction
- 2008Intermediate confirmation outranks secular phasing
- 2012Align swings to nested energy regimes
- 2016From nonconfirmation to a bearish primary trend change