2004issue C051-3
Dual-average confirmation at shared prior highs
When the industrial and transportation averages arrive together at the same old peak, a one-sided clearance stays an unfinished double-top-bottom case. The structure becomes a completed breakout only after confirmation from both averages.
- The two-average rule treats a move as significant and lasting only when the industrial and transportation averages print the same new high or low.
- A close through only one shared prior high is nonconfirmation and leaves the intermediate advance in doubt.
- A failed-prior-peak-test requires price to clear the old high and follow through higher rather than reverse from the ceiling.
- Until both averages confirm through the shared highs, an exit from the advance is not treated as signaled.
A confirmation exam at the old high
When two related averages arrive together at the same old peak, the setup is a confirmation exam rather than a finished pattern. Here, dow-theory is a two-average confirmation rule in which the industrial and transportation series must print the same new high or low before a trend change is accepted as valid. The two-average rule treats a market move as significant and lasting only when those averages confirm each other with the same new high or low.
Confirmation is both averages registering the same new extreme, treated as the only accepted proof that a trend change or completed resistance break has occurred. A new extreme printed by only one of the two averages is not accepted as a valid signal that the trend has changed. That one-sided print is nonconfirmation: one average taking out a reference high or low while the other does not, leaving the existing trend in force and the larger direction unresolved.
If the averages fail to confirm, the prevailing trend stays the working assumption and the primary direction is treated as unresolved until both averages confirm otherwise.
Both averages under the same March 2002 peaks
By mid-January 2004 the industrials were advancing from an October 2002 low and the transports from a March 2003 low, with weekly closes near 10600 and 3036 sitting less than 75 and about 15 points under the March 2002 peaks of 10673 and 3051. Both series were therefore repeating a test of the same prior-high band at the same time.
A double-top-bottom is a repeat test of a prior peak or trough. If the old high holds, a reversal hypothesis stays open. If price clears it and follows through, the top test fails and the advance can continue. A failed-prior-peak-test is defined as price reaching an old high, moving through that high, and then following through higher rather than reversing from the ceiling.
One-sided clearance is not a completed breakout
A breakout is a close through a previously respected high or base trigger that still needs the second average to confirm before it rewrites the prevailing trend. A close through only one March 2002 high, 3051 on the transports or 10673 on the industrials, was read as leaving the intermediate advance in doubt, not as proof of a collapse or of one average leading the other.
Until both averages confirmed through the 2002 highs, the case study did not treat an exit from the advance as signaled. That unfinished primary reading can sit beside a secondary-trend, an intermediate swing that can keep rising even while a larger primary reading is still treated as unresolved or opposed.
Measured-minimum context around the same test
After the spring 2003 breakout from a multi-bottom base begun in summer 2002, the transports had already reached a measured-minimum near 3022, while the industrials comparable measured-minimum remained near 10957. A measured-minimum is a minimum distance objective taken from the height of a multi-bottom base and projected from the breakout of that base.
The Nasdaq had already exceeded a multi-bottom objective near 1934 by early November 2003, whereas the S&P 500 comparable objective near 1161 still sat less than 30 points from its February 2002 area.
Editorial reading: the uneven measured-minimum progress is context for the same confirmation exam. A finished breakout still required both averages to print the same move through the shared 2002 highs.
Dow industrials test the March 2002 high
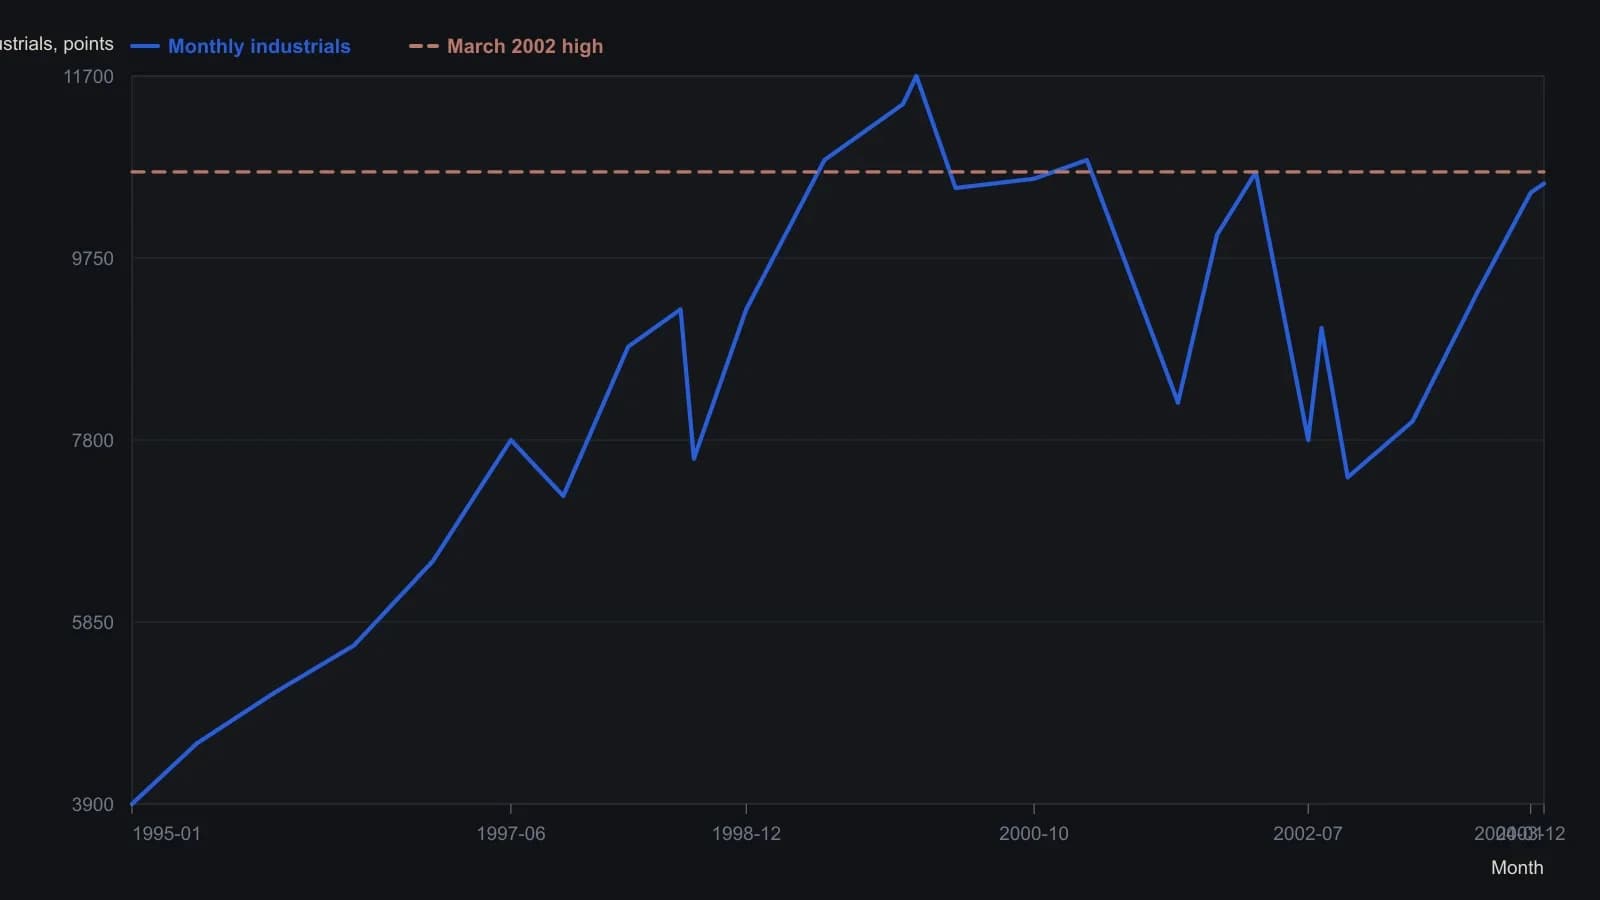
Intermediate monthly levels are approximate readings from the log-scale bar chart. The last close of 10548 is the print in the chart header; 10673 is the March 2002 high given in the article.
All readings on this track · 29 readings
- 1982A bounded-risk entry separates a forecast from a trend
- 1984Critiquing reward bias, single-scale charts, and exact-turn forecasts
- 1990Constructing dual-average primary-trend confirmation
- 1991Two-average confirmation before a primary reversal call
- 1991Delayed confirmation is not Dow Theory divergence
- 1991Confirmation delay and breadth divergence in a two-average case
- 1992Utilities as a rate-regime lead for equities
- 1992Critiquing unconfirmed Dow rallies with volume
- 1993When Dow Theory signals fail after the decision-makers change
- 1994Market life expectancy as a risk filter
- 1994Score industrial and transport sync before calling an intermediate-trend signal
- 1997A 1995 industrial-average breakout mapped from component trends
- 1998Confirm Dow trends with Market breadth and Head and shoulders
- 1999Confirming an equity idea with rate, commodity, and index spreads
- 2001Why trend, range, and Dow rules need separate tests
- 2001Bear-market confirmation via prior correction troughs
- 2002Constructing a Dow line before breakout confirmation
- 2002Two-average confirmation as a swing-by-swing classroom drill
- 2002Withhold the hypothesis until the second average confirms: a 2001 case
- 2002A primary-bear case study in cycle speed, Dow theory, and pattern legs
- 2003Four index proxies as a bear-regime dashboard
- 2004Dual-average confirmation at shared prior highs
- 2004Confirmation as the second clock on a trend break
- 2004The confirmation-reaction planning window after a joint break
- 2005Dow confirmation as a two-average trend test
- 2008Related-average confirmation lag after a correction
- 2008Intermediate confirmation outranks secular phasing
- 2012Align swings to nested energy regimes
- 2016From nonconfirmation to a bearish primary trend change