2004issue C071-4
Confirmation as the second clock on a trend break
After a constructive January, one average failed its fifty-day exponential average while the other stayed roughly flat. The case left the prior bullish hypothesis in force until both averages jointly confirmed new lows.
- A break of the fifty-day exponential average times one average's local failure. It does not, by itself, replace the prior trend hypothesis.
- Nonconfirmation is a split observation. It is not a classic confirmation-method signal.
- The downside confirmation is the March sequence in which both averages lost the February 24 higher lows, then took out January and February lows while closing under the fifty-day exponential average.
- A contracting range and histogram overlay state a next-break test during the wait. They are not permission to act on a split tape.
Two clocks on the same chart
The case follows the industrial average and the transport average after a constructive January. A moving average is a lookback smoother on ordered prices, used here as an explicit daily and weekly baseline against which closes and tests can be compared. Confirmation is a joint event in which two related averages register the same kind of new high or new low, supporting a continuation or a change-of-trend reading.
Editorial reading: treat those checks as two clocks on the same chart. The moving-average break is the first clock. It times when one series has failed its own baseline. Confirmation is the second clock. A joint two-average confirmation is the only event allowed to replace the prior trend hypothesis.
Where the split began
The last bullish confirmation of the advance is dated to the industrials' January 26 high validating the transports' January 22 high. That juncture is identified as the start of the later split between the two averages.
In February the transport average broke down beneath its fifty-day exponential average while the industrial average was roughly flat. The industrials did not confirm the transports' new lows.
Nonconfirmation is not a reversal
A split or nonconfirmation between the two averages is explicitly distinguished from a classic confirmation-method signal. It is treated as an observation only. One average can print a new extreme that the other does not, and the prior bullish hypothesis remains in force.
Dow industrials daily close and 50-day exponential average
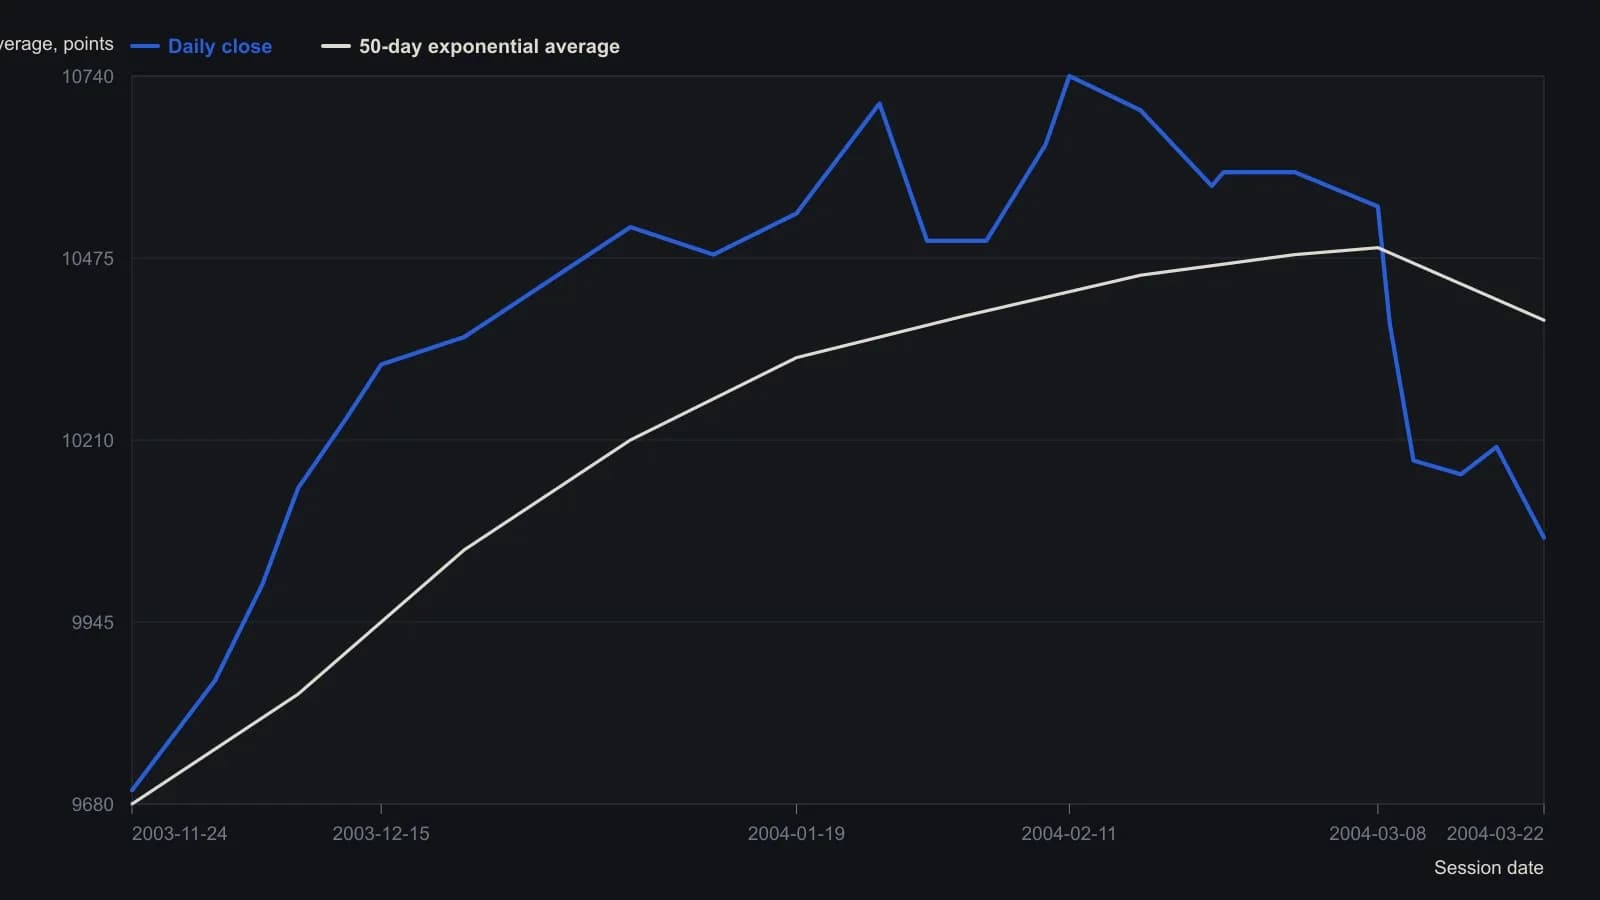
Source pane is daily candlesticks with Stochastic (7,4,10) and MACD (12,26,9) that are not carried over. Intermediate closes are approximate to the nearest 20 index points; only the two right-edge scale labels are exact.
When both averages confirm lower
From March 9 through March 11 the industrials fell through their fifty-day exponential average while the transports simultaneously took out February lows, producing a joint downside confirmation after the January highs.
Both averages printed higher lows on February 24, then both closed beneath that higher-low level on March 9. The next session both took out January and February lows and kept closing under their fifty-day exponential averages, which the case treated as a completed downside confirmation.
From the January 2004 transport high and the February 2004 industrial high, the declines are measured at about 11% and closer to 6% respectively. A durable upturn is withheld until a later bullish confirmation appears.
The fifty-week exponential average
On weekly charts both averages were moving toward fifty-week exponential averages, treated as roughly equivalent to a 200-session average. A review back to 1999 found no weekly downtrend in either average that was actually stopped at that line.
Weekly industrials are described as significantly extended above the fifty-week exponential average and overdue for a sizable correction, without deciding whether that correction would reopen a longer decline or only reset a cyclical advance.
The waiting range
Histogram readings on the industrials' lengthening February consolidation are flagged as a cautionary overlay. Related material pairing symmetrical triangle structure with that same histogram is attached as further study of the waiting range.
The triangle pattern here is a contracting swing range. Its converging boundaries define a repeatable chart condition that can be paired with those histogram readings to form a testable break hypothesis.
All readings on this track · 29 readings
- 1982A bounded-risk entry separates a forecast from a trend
- 1984Critiquing reward bias, single-scale charts, and exact-turn forecasts
- 1990Constructing dual-average primary-trend confirmation
- 1991Two-average confirmation before a primary reversal call
- 1991Delayed confirmation is not Dow Theory divergence
- 1991Confirmation delay and breadth divergence in a two-average case
- 1992Utilities as a rate-regime lead for equities
- 1992Critiquing unconfirmed Dow rallies with volume
- 1993When Dow Theory signals fail after the decision-makers change
- 1994Market life expectancy as a risk filter
- 1994Score industrial and transport sync before calling an intermediate-trend signal
- 1997A 1995 industrial-average breakout mapped from component trends
- 1998Confirm Dow trends with Market breadth and Head and shoulders
- 1999Confirming an equity idea with rate, commodity, and index spreads
- 2001Why trend, range, and Dow rules need separate tests
- 2001Bear-market confirmation via prior correction troughs
- 2002Constructing a Dow line before breakout confirmation
- 2002Two-average confirmation as a swing-by-swing classroom drill
- 2002Withhold the hypothesis until the second average confirms: a 2001 case
- 2002A primary-bear case study in cycle speed, Dow theory, and pattern legs
- 2003Four index proxies as a bear-regime dashboard
- 2004Dual-average confirmation at shared prior highs
- 2004Confirmation as the second clock on a trend break
- 2004The confirmation-reaction planning window after a joint break
- 2005Dow confirmation as a two-average trend test
- 2008Related-average confirmation lag after a correction
- 2008Intermediate confirmation outranks secular phasing
- 2012Align swings to nested energy regimes
- 2016From nonconfirmation to a bearish primary trend change