2005issue C081-3
Dow confirmation as a two-average trend test
This archive case records two same-day bullish confirmations when the industrial and transportation averages jointly took out prior highs. After transports later broke their December 2004 lows while industrials stayed above theirs, the January decline remained an unconfirmed break inside the larger advance. Near-term caution came from a monthly sell divergence, trend-channel reentry, and a close below the fifty-day exponential average, with a positive stochastic divergence required before any bounce in transports was treated as valid.
- Same-day confirmation means both related averages take out a shared prior extreme on the same session, and the case treats that as a stronger but not uniquely valid form of Dow Theory confirmation.
- An unconfirmed break leaves the larger advance in force: one average can take out a prior low and the decline is still a setback until the second average confirms to the downside.
- Monthly sell divergence, trend-channel reentry, and a close below the fifty-day exponential average supported near-term bearish pressure without converting the January decline into a confirmed bearish trend change.
- Once transports were already below the fifty-day exponential average, the case required a positive stochastic divergence on the seven-ten stochastic before treating a bounce as valid.
A two-average confirmation test
This archive case uses the industrial and transportation averages to show how a Dow Theory confirmation is recorded. A bullish confirmation requires both averages to take out a shared prior high. A bearish trend change requires both averages to take out a shared prior low.
Until the second average agrees, the first break is not enough to flip the larger classification. That is the confirmation gate the case applies to both the autumn advance and the January decline.
Same-day confirmation on the November and December highs
On 4 November the industrial and transportation averages both surpassed their October highs in the same session. The case treats that session as a same-day confirmation: both related averages take out a shared prior extreme on the same session. The case treats this as a stronger but not uniquely valid form of Dow Theory confirmation.
After the 4 November close, the industrials advanced about 2.3 percent over the next thirty-odd days and posted a closing high more than 500 points above that reference by 28 December. The transports advanced about 4 percent over those thirty days and a further 3 percent before a 29 December closing high.
A second same-session bullish confirmation was recorded on 1 December, when both averages simultaneously exceeded their November closing highs.
Dow industrials daily with 10- and 50-day exponential averages
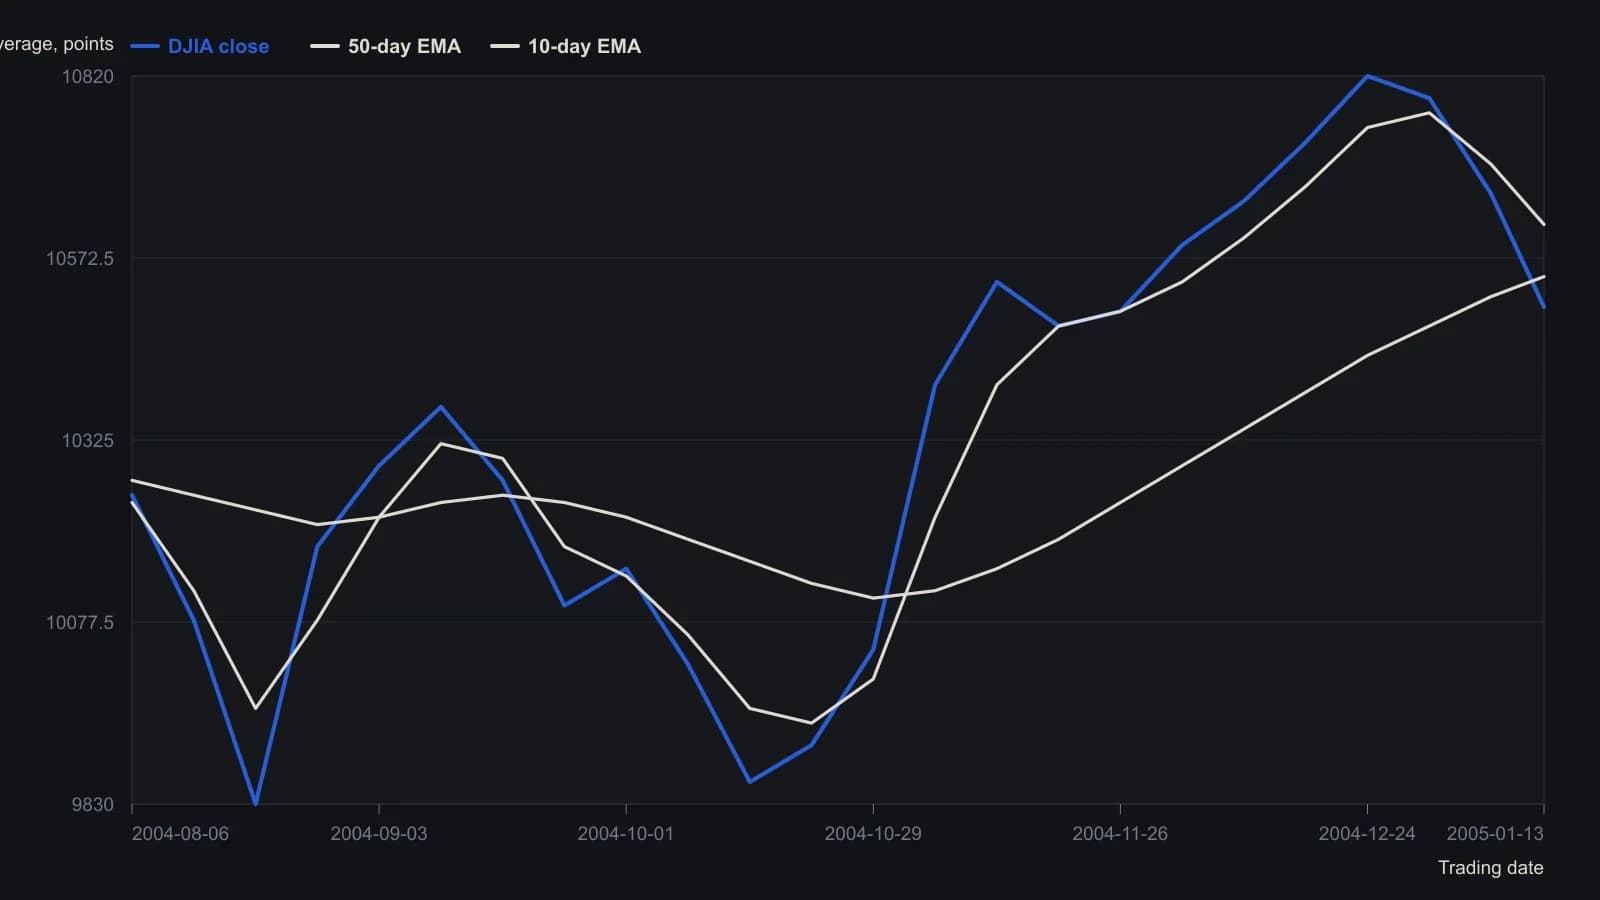
Daily candlesticks were sampled about once a week so the raster is not over-read. Earlier levels are rounded to 10 points. The 7,10 stochastic and MACDH histogram in the lower pane were not transferred.
An unconfirmed break in January
By 5 January the transports had already broken their December 2004 lows, while the industrials remained about 150 points above those lows. That pattern is an unconfirmed break: one average has already taken out a prior low while the second average has not. Until that second break occurs, the decline is still classified as a setback inside the existing advance. The case therefore still classified the January decline as a correction inside the larger advance rather than a confirmed bearish trend change.
The case held that even a transport break of the November 2004 lows near 3450 would remain a temporary setback unless the industrials also confirmed to the downside. A close in the industrials below about 10198.75 was treated as a major warning of further downside that could also complete a bearish confirmation with the transports.
Secondary filters that do not close the gate
Near-term bearish pressure was supported by a monthly sell divergence on the industrials, a return inside the trend channel that had framed the rally from the August 2004 lows, and an industrials close below the fifty-day exponential average.
A monthly sell divergence reads a lower oscillator peak, on a monthly scale, against a still-rising or comparable price high as fading internal strength in the advance. The monthly industrials chart still showed a lower stochastic peak over the August 2004-to-present advance. A negative stochastic divergence was said to have preceded the weakness in both averages, and both negative divergences had already been confirmed.
Trend-channel reentry is price moving back inside the channel that framed the prior rally. The case treats that return as a loss of breakout character, not as an automatic trend reversal. The fifty-day exponential average is a medium-horizon moving-average line used here as a location filter: a close back beneath it argues that downside work is unfinished, and it also changes which bounce rule applies.
A bounce rule below the fifty-day line
Because the transports were already below the fifty-day exponential average, the case required a positive stochastic divergence rather than a MACD-histogram uptick alone before treating a bounce as valid. Positive stochastic divergence means price prints a lower low while a seven-ten stochastic holds a higher or equal low.
Transports printed sequentially lower price lows on 7 January and 13 January while the seven-ten stochastic had not yet printed sequentially lower oscillator lows. A near-term bounce could still produce a higher stochastic low and a positive divergence. The seven-ten stochastic is a short-lookback stochastic used both for daily oversold context and for comparing successive oscillator highs and lows against price.
All readings on this track · 29 readings
- 1982A bounded-risk entry separates a forecast from a trend
- 1984Critiquing reward bias, single-scale charts, and exact-turn forecasts
- 1990Constructing dual-average primary-trend confirmation
- 1991Two-average confirmation before a primary reversal call
- 1991Delayed confirmation is not Dow Theory divergence
- 1991Confirmation delay and breadth divergence in a two-average case
- 1992Utilities as a rate-regime lead for equities
- 1992Critiquing unconfirmed Dow rallies with volume
- 1993When Dow Theory signals fail after the decision-makers change
- 1994Market life expectancy as a risk filter
- 1994Score industrial and transport sync before calling an intermediate-trend signal
- 1997A 1995 industrial-average breakout mapped from component trends
- 1998Confirm Dow trends with Market breadth and Head and shoulders
- 1999Confirming an equity idea with rate, commodity, and index spreads
- 2001Why trend, range, and Dow rules need separate tests
- 2001Bear-market confirmation via prior correction troughs
- 2002Constructing a Dow line before breakout confirmation
- 2002Two-average confirmation as a swing-by-swing classroom drill
- 2002Withhold the hypothesis until the second average confirms: a 2001 case
- 2002A primary-bear case study in cycle speed, Dow theory, and pattern legs
- 2003Four index proxies as a bear-regime dashboard
- 2004Dual-average confirmation at shared prior highs
- 2004Confirmation as the second clock on a trend break
- 2004The confirmation-reaction planning window after a joint break
- 2005Dow confirmation as a two-average trend test
- 2008Related-average confirmation lag after a correction
- 2008Intermediate confirmation outranks secular phasing
- 2012Align swings to nested energy regimes
- 2016From nonconfirmation to a bearish primary trend change