2004issue C121-3
The confirmation-reaction planning window after a joint break
Under Dow Theory, a primary-trend change waits until industrials and transports jointly break the same swing. In 2004 both the March and August bearish confirmations were followed first by a bounce, so the print delayed follow-through instead of acting as a same-session trigger. Editorial reading: later nonconfirmations, the 50-day exponential average, and extreme MACD histogram readings mark when that pause is aging.
- Under Dow Theory, a primary-trend change is treated as valid only when the industrial and transportation averages jointly break the same prior swing. Action by one average alone does not produce a trend-change signal.
- After the March and August 2004 bearish confirmations, both averages first reversed higher before later making lower lows. The confirmation-reaction delayed follow-through instead of acting as instant downside action.
- A nonconfirmation leaves the last joint confirmation in force. In May and June 2004 the split readings kept the March bearish confirmation as the definition of the primary trend, even after later declines of 6.5 percent and 7.5 percent.
- Editorial reading: the 50-day exponential average during the bounce and extreme MACD histogram readings mark when the post-confirmation pause is aging, not a same-session action trigger.
Joint confirmation names the primary trend
Under Dow Theory, a primary-trend change is not treated as valid until both the industrial and transportation averages confirm the same break. Action by one average alone does not produce a trend-change signal.
Confirmation is that joint break of the same prior swing. Until it appears, the last valid confirmation still names the primary trend.
The March confirmation-reaction
The first confirmation of 2004 was a same-day March break of the February lows by both averages. That joint print was later treated as that year's first major bearish signal.
Within 10 days of the March confirmation both averages reversed higher. They later tested their March highs, and the transportation average also tested its February high.
That short rebound is the confirmation-reaction: a rebound that can appear shortly after a joint confirmation, delaying follow-through and opening a later window to evaluate the signal. It was also a secondary-reaction, an intermediate swing against a still-intact primary trend.
Nonconfirmation leaves the last signal in force
In May the industrial average broke its March lows while the transportation average remained above its March lows. That split is a nonconfirmation, and the prevailing trend stayed classified as intact.
After a June upside nonconfirmation the industrial average later declined 6.5 percent and the transportation average declined 7.5 percent. The March bearish confirmation still defined the primary trend.
The split can still inform swing context. It does not replace the last joint confirmation as the reading of the major direction.
The August print repeated the delay
In early August both averages broke their July lows on the same day. The transportation average did not break its May lows, so the pair did not jointly set new year-to-date lows. The August print was still a bearish confirmation of the July lows.
Within five days of that July-low break both averages were again rising. By the sixth day the bounce toward the 50-day exponential moving average was clear, and the transportation average was trading above that average.
After both the March and August bearish confirmations the averages first reversed higher before later making lower lows. The immediate post-signal bounce again functioned as a delay rather than as instant downside follow-through.
Dow Industrials after the August 2004 joint break
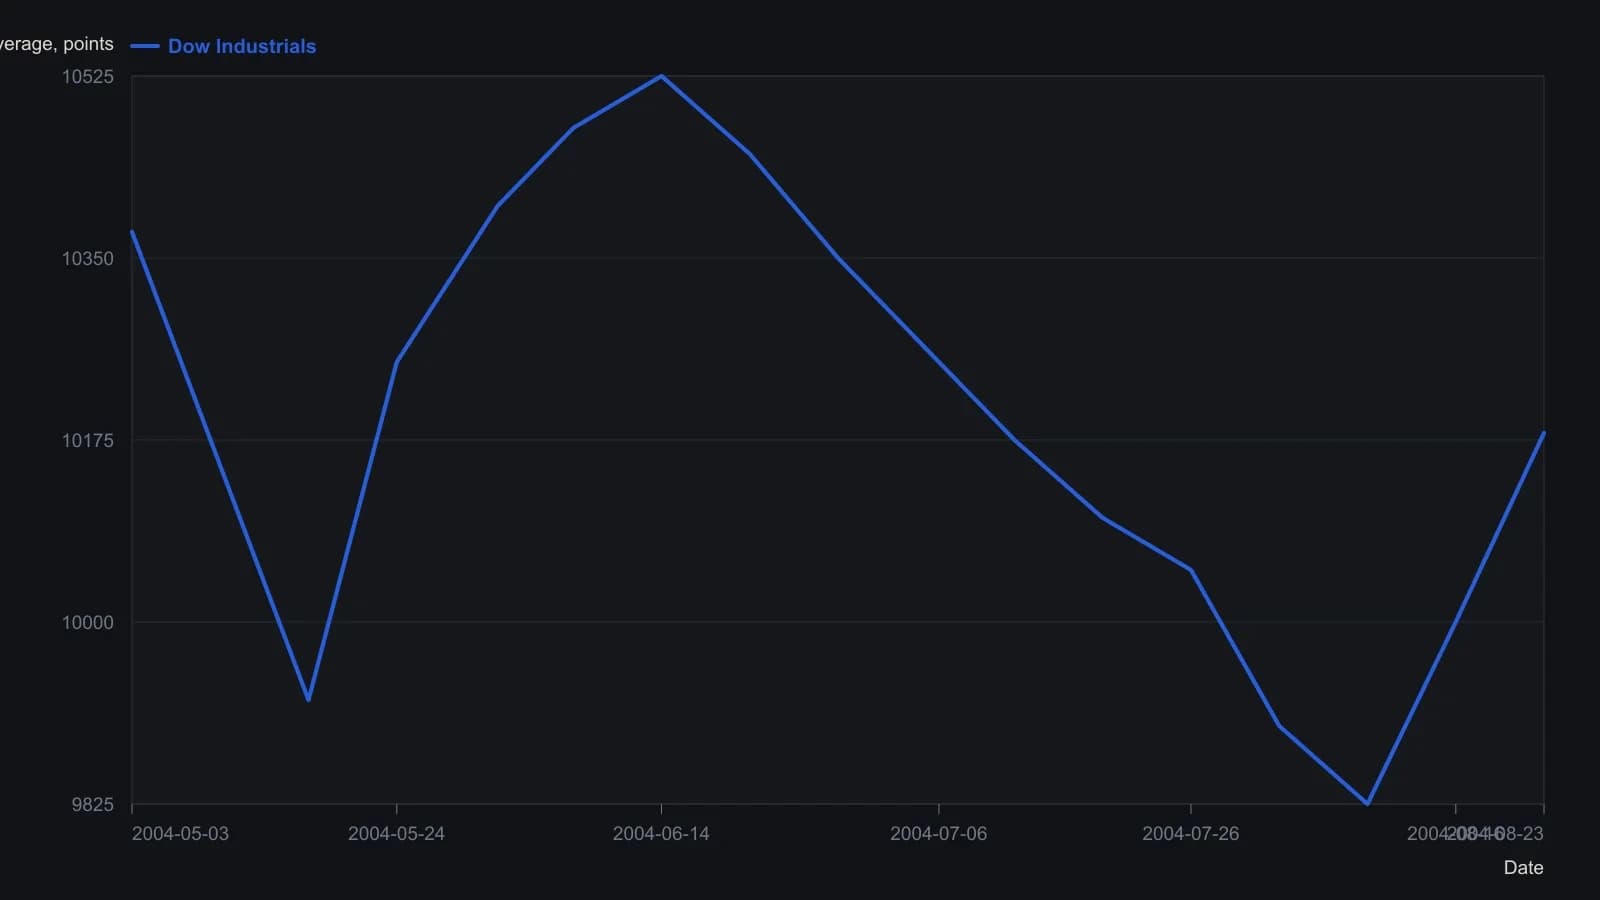
Closes between labeled gridlines are rounded to the nearest 25 points; only the 23 August last price is printed on the source chart. The upper pane plots the Dow transports, which confirmed the July-low break but held above the May low; that series sits on a different scale and is not overlaid here.
The 50-day average and the MACD histogram
The 50-day exponential average is used here as an intermediate-term resistance reference during the bounce that can follow a joint confirmation. In the August confirmation-reaction, that bounce toward the average was already clear by the sixth day, with the transportation average trading above it.
Extreme MACD histogram readings can be watched as a leading indication that trend conditions may be changing, rather than as a same-session action trigger. Editorial reading: those extremes, together with later nonconfirmations and the 50-day average, mark when the post-confirmation pause is aging. They do not turn the histogram into a same-session action trigger.
Editorial reading of the 2004 sequence
Editorial reading of the 2004 workflow: confirmation is the clock that starts after both averages print the same break. The confirmation-reaction is the pause that keeps that print from becoming the trade. Nonconfirmations later show that the primary trend has not been replaced. The 50-day exponential average and a stretched MACD histogram are later checks on whether that pause is getting old.
All readings on this track · 29 readings
- 1982A bounded-risk entry separates a forecast from a trend
- 1984Critiquing reward bias, single-scale charts, and exact-turn forecasts
- 1990Constructing dual-average primary-trend confirmation
- 1991Two-average confirmation before a primary reversal call
- 1991Delayed confirmation is not Dow Theory divergence
- 1991Confirmation delay and breadth divergence in a two-average case
- 1992Utilities as a rate-regime lead for equities
- 1992Critiquing unconfirmed Dow rallies with volume
- 1993When Dow Theory signals fail after the decision-makers change
- 1994Market life expectancy as a risk filter
- 1994Score industrial and transport sync before calling an intermediate-trend signal
- 1997A 1995 industrial-average breakout mapped from component trends
- 1998Confirm Dow trends with Market breadth and Head and shoulders
- 1999Confirming an equity idea with rate, commodity, and index spreads
- 2001Why trend, range, and Dow rules need separate tests
- 2001Bear-market confirmation via prior correction troughs
- 2002Constructing a Dow line before breakout confirmation
- 2002Two-average confirmation as a swing-by-swing classroom drill
- 2002Withhold the hypothesis until the second average confirms: a 2001 case
- 2002A primary-bear case study in cycle speed, Dow theory, and pattern legs
- 2003Four index proxies as a bear-regime dashboard
- 2004Dual-average confirmation at shared prior highs
- 2004Confirmation as the second clock on a trend break
- 2004The confirmation-reaction planning window after a joint break
- 2005Dow confirmation as a two-average trend test
- 2008Related-average confirmation lag after a correction
- 2008Intermediate confirmation outranks secular phasing
- 2012Align swings to nested energy regimes
- 2016From nonconfirmation to a bearish primary trend change