2003issue C021-2
Four index proxies as a bear-regime dashboard
A historical four-proxy reading used financials, utilities, semiconductors, and transports to judge a bounce by participation, defensiveness, leadership-range repair, and Dow Theory confirmation of industrials.
- Treat each sector basket as an index-proxy for a regime question, not as a single-name trade.
- Financials were the participation check: after late 2000, each meaningful general-stock bear-market-rally was said to arrive with a still-sharper advance in financial stocks.
- Utilities test whether the old haven still behaves defensively, while semiconductors test whether prior leadership has repaired the band later marked by a trading-range-break.
- Dow Theory treats a directional or economic-strength call as jointly supported only when transportation-average and industrial-average price action confirm each other.
A four-proxy reading of a bounce
After late 2000, a review of general-stock declines treated four industry averages as context for each bounce. The NYSE financial index, the Dow Jones utilities average, the Philadelphia semiconductor index, and the Dow Jones transportation average were each described as a sector or industry basket rather than as a single-name story.
Editorially, TradersWeek reads that pairing as a four-proxy bounce checklist. Each average is an index-proxy: a stand-in for a broader market or economic regime. Intermarket-analysis then means judging one bounce against participation, defensiveness, and leadership across those related markets.
Financials as a participation check
The NYSE financial index was described as covering more than 900 banks, brokerages, savings-and-loan firms, insurers, and other financial corporations, and as a tracker of widely traded financial names on that exchange.
After late 2000, each meaningful general-stock bear-market-rally cited in the review was said to arrive with a still-sharper advance in financial stocks. The turning points were dated March 2001, September 2001, July 2002, and October 2002.
Editorially, that pattern is the participation test. A bounce in the broad list is read as more complete when financials lead it, and as thinner when they do not.
Utilities as a haven check
The Dow Jones utilities average was described as 15 leading water, gas, and electric distributors, some of which had expanded into energy trading, and as having been founded in 1929.
Utilities were framed as a former stress-period haven whose industry average had been in a serious decline since a late-2000 peak. Limited ability to pass higher power or gas costs through to customers was cited as a structural constraint.
Editorially, the haven check asks whether that old defensive group still behaves as a refuge, or whether the constraint has left it unable to play that role during a decline.
Semiconductors as a leadership-range check
The Philadelphia semiconductor index was described as 16 U.S. chip developers and manufacturers and as a general gauge of technology-industry health.
After holding a trading range from September 2000 to March 2002, semiconductor stocks were described as breaking below that range in the second half of 2002. That move is a trading-range-break: a move beneath a multi-month sideways band that had previously contained post-crash prices, used here as a regime-change marker. A Nasdaq print of 1,184 on September 23 was noted as a level last seen in September 1996.
Editorially, the leadership-range check asks whether prior technology leadership has repaired that band. A break beneath it argues that the old leadership group has not yet restored the range that held after the crash.
Transports as a Dow Theory check
The Dow Jones transportation average was described as the oldest of the three main Dow averages and as 20 price-weighted U.S. airlines, air-freight, trucking, and railroad companies, originally assembled from major railroads. In that construction it is a price-weighted-average, so each component's influence depends on its share price rather than its market capitalization.
Dow Theory was presented as a comparison of transportation-average and industrial-average price action used to anticipate market direction and economic strength or weakness. Sharp transport rallies from troughs since 2001, especially from the October 2002 lows, were used to illustrate confidence in that autumn bounce.
Editorially, the transport check is the confirmation step. Dow Theory treats a directional or economic-strength call as jointly supported only when the two averages confirm each other, rather than when industrials bounce alone.
NYSE Financial Index through the 2000–2002 bear
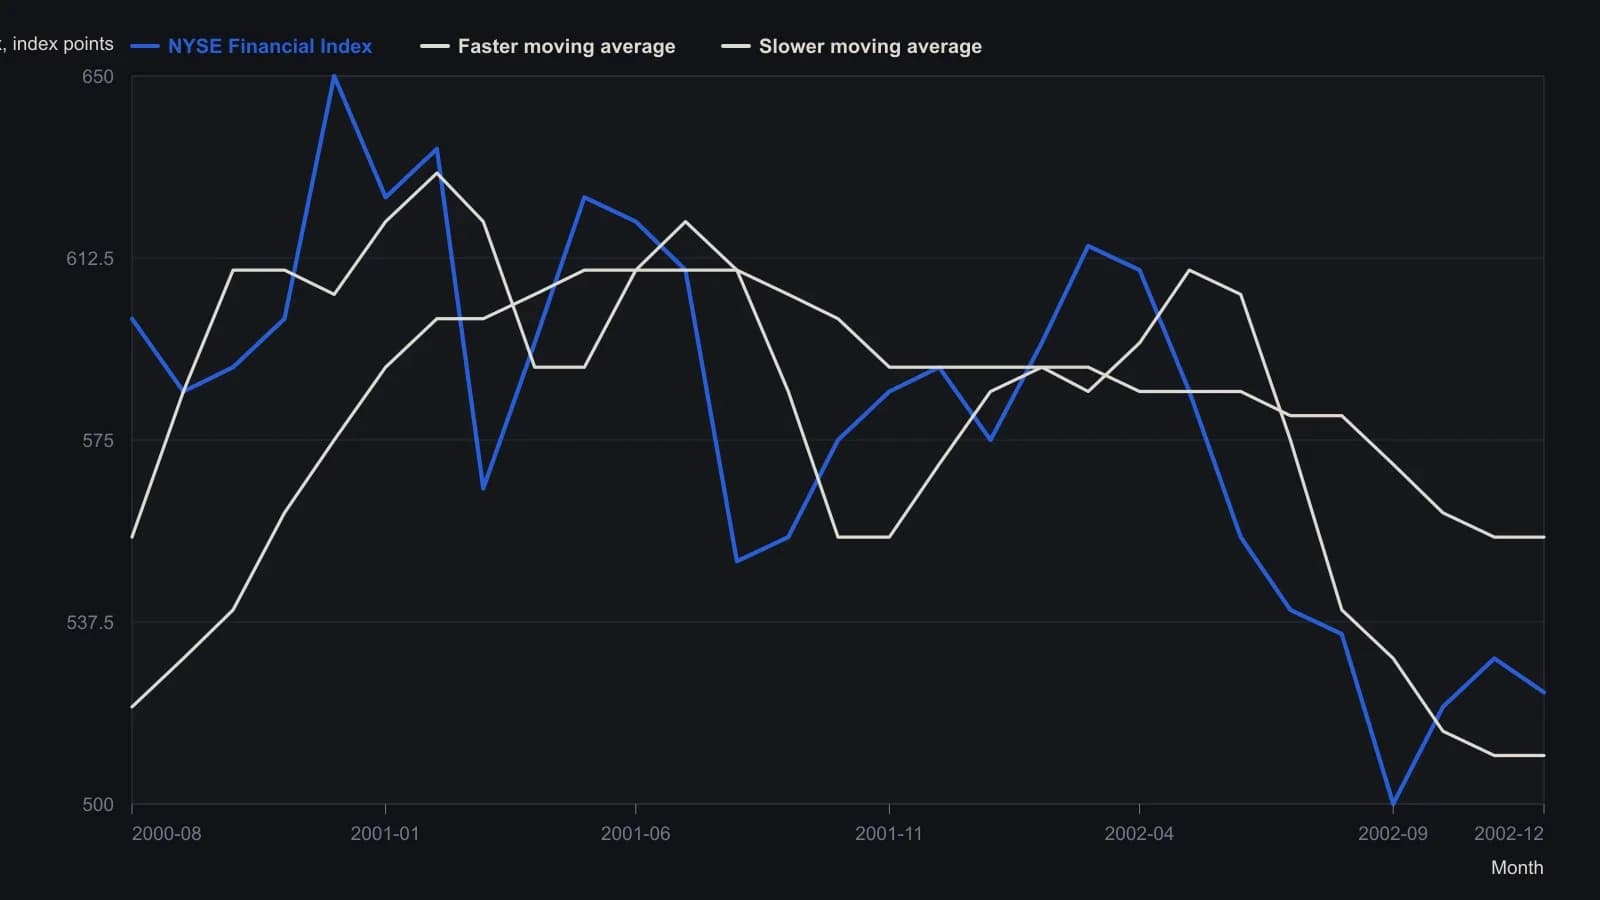
Moving-average lengths are not labeled on the source plot. Intermediate levels are approximate monthly reads from the daily bars, not official settlement prints.
Reading the four checks together
The archive described the four averages side by side. It did not present them as a mechanical score, and it did not turn any one bounce into a stand-alone forecast.
Editorially, disagreement among the proxies is the point of the dashboard. A bear-market-rally can still print in the broad list while financials fail the participation test, utilities fail the haven test, semiconductors fail the leadership-range test, or transports fail to confirm industrials. Those gaps do not erase the bounce. They mark it as a less complete regime reading.
All readings on this track · 29 readings
- 1982A bounded-risk entry separates a forecast from a trend
- 1984Critiquing reward bias, single-scale charts, and exact-turn forecasts
- 1990Constructing dual-average primary-trend confirmation
- 1991Two-average confirmation before a primary reversal call
- 1991Delayed confirmation is not Dow Theory divergence
- 1991Confirmation delay and breadth divergence in a two-average case
- 1992Utilities as a rate-regime lead for equities
- 1992Critiquing unconfirmed Dow rallies with volume
- 1993When Dow Theory signals fail after the decision-makers change
- 1994Market life expectancy as a risk filter
- 1994Score industrial and transport sync before calling an intermediate-trend signal
- 1997A 1995 industrial-average breakout mapped from component trends
- 1998Confirm Dow trends with Market breadth and Head and shoulders
- 1999Confirming an equity idea with rate, commodity, and index spreads
- 2001Why trend, range, and Dow rules need separate tests
- 2001Bear-market confirmation via prior correction troughs
- 2002Constructing a Dow line before breakout confirmation
- 2002Two-average confirmation as a swing-by-swing classroom drill
- 2002Withhold the hypothesis until the second average confirms: a 2001 case
- 2002A primary-bear case study in cycle speed, Dow theory, and pattern legs
- 2003Four index proxies as a bear-regime dashboard
- 2004Dual-average confirmation at shared prior highs
- 2004Confirmation as the second clock on a trend break
- 2004The confirmation-reaction planning window after a joint break
- 2005Dow confirmation as a two-average trend test
- 2008Related-average confirmation lag after a correction
- 2008Intermediate confirmation outranks secular phasing
- 2012Align swings to nested energy regimes
- 2016From nonconfirmation to a bearish primary trend change