2002issue C041-3
Constructing a Dow line before breakout confirmation
A Dow line is a boxed equilibrium, not a forecast. Build the narrow range first, leave both sides unnamed while it forms, and wait for a volume-backed exit that can still fail back into the line.
- A Dow line is constructed as a multi-week to multi-month interval in which price neither advances nor declines by a significant amount, often tested as a 5 percent line-range-band.
- Accumulation, distribution, and owner-transfer all continue while the line is forming, so the finished box does not identify which side will dominate.
- An exit is read as a possible new advance or decline, more so with large volume, and is unsuccessful if price returns through a stop placed just inside the constructed line.
- Prior-trend-length is only an outside clue: a young trend plus a line may still be accumulating, while a mature trend plus a line may be nearer a late-stage correction or reversal.
What a Dow line is
A Dow line is constructed as an interval in which prices neither advance nor decline by a significant amount. That interval can last from a few weeks to several months. In the sense used here, a Dow line is a multi-week to multi-month stretch of price action in which neither buyers nor sellers produce a significant net advance or decline, leaving a boxed equilibrium.
One construction test used to call a range a Dow line is that price variation stays inside a 5 percent band. That corridor is the line-range-band. The geometry of the line does not disclose whether price will leave it upward or downward.
Owner-transfer inside the line
Accumulation is buying of inventory inside the line, often by better-capitalized participants absorbing discounted supply. Distribution is selling of inventory inside the line, often by better-informed holders passing shares to later buyers. Those two processes can run together while the line is still being built.
Owner-transfer is the two-way exchange of shares that continues throughout line construction. Inside the line, inventory can pass from stronger holders to later buyers after an advance, or from tired holders to stronger buyers after a decline. The finished box records that exchange. It does not name the side that will later dominate.
Breakout-confirmation after the box is finished
An upward exit from a completed line is read as a possible new or renewed advance, and a downward exit as a possible new decline. Those exits are treated as more significant when they occur with large trading volume. Breakout-confirmation is that directional exit from the finished line, treated as more informative when it occurs with large volume.
The breakout method marks an unsuccessful exit by placing mental or physical stops just inside the constructed line. If price returns through that stop, the exit is unsuccessful.
DJIA: two Dow lines into the 2001 bear market
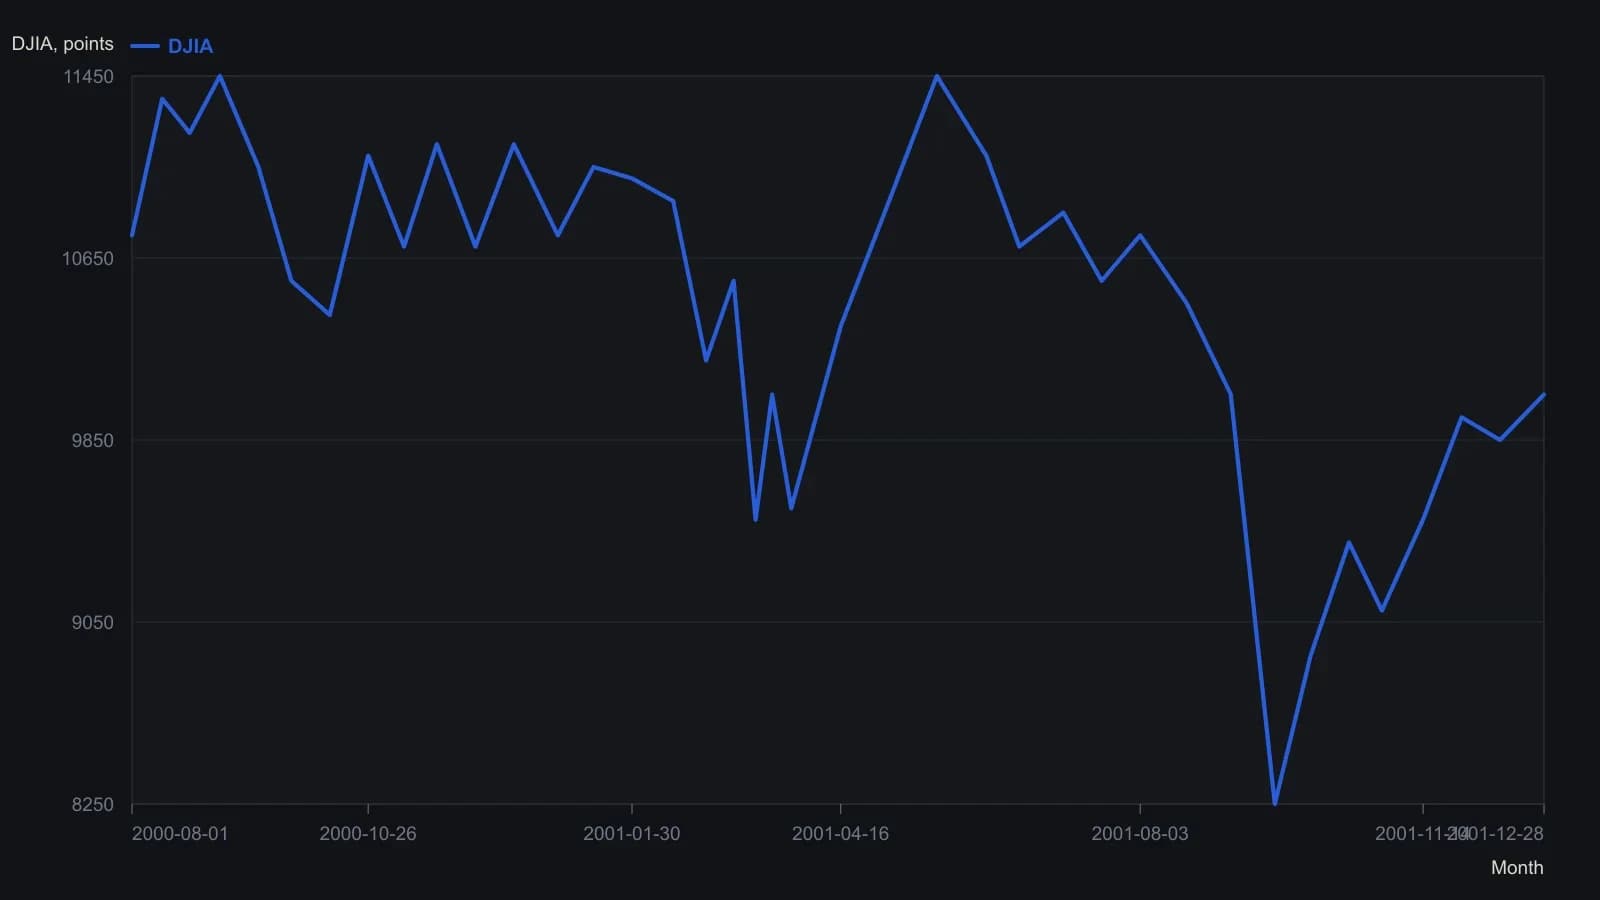
Read from the right-hand MetaStock scale, which is marked ×10. Turning points are rounded to about 50 index points; if the figure plotted closes, intra-bar extremes are not in this series.
Prior-trend-length as an outside clue
The length of the trend leading into the line is used as an outside clue. A young trend plus a line may mark further accumulation, while a long mature trend plus a line may mark a late-stage correction or reversal.
Prior-trend-length is a companion reading that asks whether the line sits in a young trend that may still be accumulating or in a mature trend that may be nearer a reversal. It remains an outside clue. The geometry of the line still does not disclose whether price will leave it upward or downward.
All readings on this track · 29 readings
- 1982A bounded-risk entry separates a forecast from a trend
- 1984Critiquing reward bias, single-scale charts, and exact-turn forecasts
- 1990Constructing dual-average primary-trend confirmation
- 1991Two-average confirmation before a primary reversal call
- 1991Delayed confirmation is not Dow Theory divergence
- 1991Confirmation delay and breadth divergence in a two-average case
- 1992Utilities as a rate-regime lead for equities
- 1992Critiquing unconfirmed Dow rallies with volume
- 1993When Dow Theory signals fail after the decision-makers change
- 1994Market life expectancy as a risk filter
- 1994Score industrial and transport sync before calling an intermediate-trend signal
- 1997A 1995 industrial-average breakout mapped from component trends
- 1998Confirm Dow trends with Market breadth and Head and shoulders
- 1999Confirming an equity idea with rate, commodity, and index spreads
- 2001Why trend, range, and Dow rules need separate tests
- 2001Bear-market confirmation via prior correction troughs
- 2002Constructing a Dow line before breakout confirmation
- 2002Two-average confirmation as a swing-by-swing classroom drill
- 2002Withhold the hypothesis until the second average confirms: a 2001 case
- 2002A primary-bear case study in cycle speed, Dow theory, and pattern legs
- 2003Four index proxies as a bear-regime dashboard
- 2004Dual-average confirmation at shared prior highs
- 2004Confirmation as the second clock on a trend break
- 2004The confirmation-reaction planning window after a joint break
- 2005Dow confirmation as a two-average trend test
- 2008Related-average confirmation lag after a correction
- 2008Intermediate confirmation outranks secular phasing
- 2012Align swings to nested energy regimes
- 2016From nonconfirmation to a bearish primary trend change