1997issue C021-8
A 1995 industrial-average breakout mapped from component trends
A June 1995 research note treated the industrial average crossing 4000 as a major breakout, then used component charts, a participation check, and older analog declines to decide whether that map should stay in force.
- A June 1995 note assembled more than 150 chart examples, including seven Dow Jones Industrial Average components, to argue that component uptrends could support a much higher average after the early 1995 breakout through 4000.
- Bottom-up confirmation used later Boeing, Eastman Kodak, and United Technologies charts as a then-versus-now check of whether those component uptrends continued.
- Market-breadth treated 500-plus million shares on up days as evidence that the advance was broadly used, not merely an average-level event.
- The analog map stayed in force until speculative excess appeared. A faster-than-expected rally was read as a two-way fork, not as proof that the comparison had failed.
A breakout read from the components first
A June 1995 research note assembled more than 150 chart examples, including seven Dow Jones Industrial Average components. The note argued that component uptrends could support a much higher industrial-average level. The same case treated the industrial average crossing 4000 in early 1995 as a major breakout.
A breakout, in this workflow, is a move through a long-standing average level. It is treated as a change in market state only if component trends and participation remain consistent.
Boeing monthly into the June 1995 resistance break
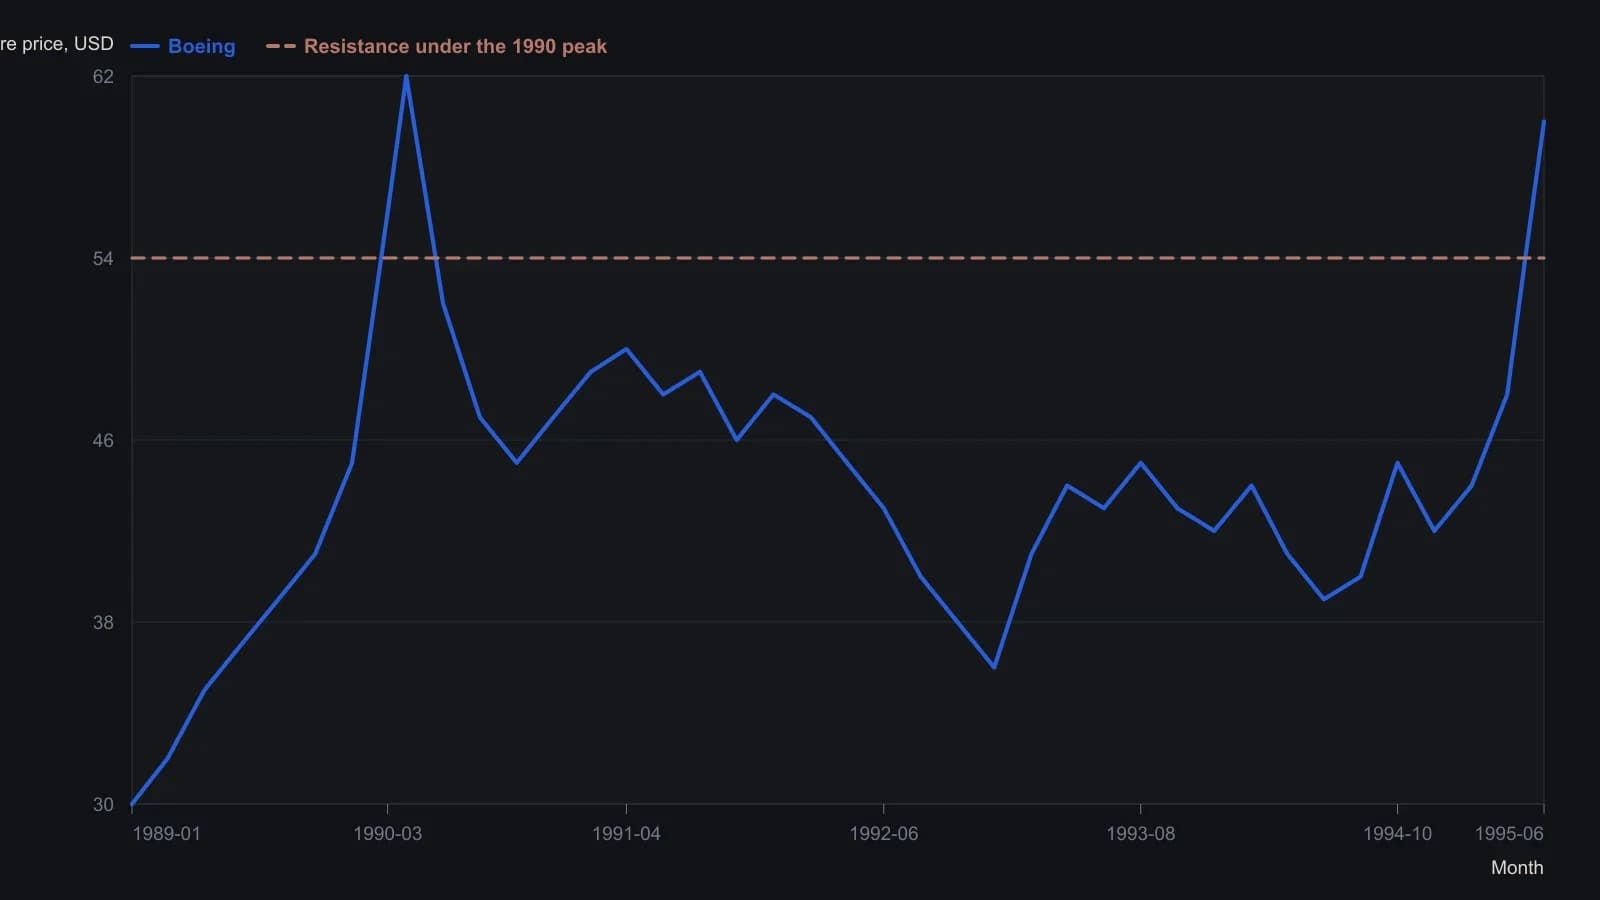
Approximate monthly closes digitized from OHLC bars on the source raster. The printed scale 240–640 is $24–$64. The last bar is the June 1995 snapshot from the Dow 7000 note.
Trend-following as a map, not a single number
The teaching procedure in the note was to keep the method simple. Follow the trend. Use bottom-up chart work. Treat that combination as a map rather than as a one-number forecast.
Trend-following is a rule-based procedure that stays with the prevailing price direction of an average or component until a defined reversal or invalidation condition appears. Bottom-up confirmation means reading many individual component charts first, then letting those component trends support or challenge a headline average forecast.
Later Boeing, Eastman Kodak, and United Technologies charts were used as a then-versus-now check of whether those component uptrends continued.
Market-breadth as a participation check
A participation check in the same discussion treated 500-plus million shares on up days as basic breadth evidence that an advance was broadly used, not merely an average-level event. Market-breadth asks how many issues and how much volume confirm an average move rather than treating the average as a standalone signal.
Historical analogs and a forgotten decline
Dow Theory here is a confirmation framework that treats major-average structure, related averages, and prior analog declines as one map of supply, demand, and market psychology.
The 1994 decline was described as a forgotten stealth bear market. A stealth decline is a correction that is later forgotten because the subsequent advance resumes quickly, yet still belongs in the analog set. It was kept in the comparison set when later observers claimed the current tape had no precedent.
A July 1996 industrial-average decline of 11.6 percent in six weeks, measured with intraday highs and lows, was placed next to a 1965 decline of 11.9 percent in four weeks. That pairing is a historical analog: a prior episode with a similar percentage decline and time span used as a comparison case, not as a guarantee of repetition. The later swing was treated as a comparable move rather than as a unique modern event.
What kept the map in force
The stated invalidation trigger was not a modest pullback by itself but the appearance of a lot of speculation. Speculative excess is a change-of-mind condition defined by widespread speculative behavior rather than by a modest percentage pullback alone. Until that condition appeared, the analog map remained in force.
A faster-than-expected rally was read as a two-way fork: either the advance would end sooner than planned or the trend was stronger than the analog implied.
All readings on this track · 29 readings
- 1982A bounded-risk entry separates a forecast from a trend
- 1984Critiquing reward bias, single-scale charts, and exact-turn forecasts
- 1990Constructing dual-average primary-trend confirmation
- 1991Two-average confirmation before a primary reversal call
- 1991Delayed confirmation is not Dow Theory divergence
- 1991Confirmation delay and breadth divergence in a two-average case
- 1992Utilities as a rate-regime lead for equities
- 1992Critiquing unconfirmed Dow rallies with volume
- 1993When Dow Theory signals fail after the decision-makers change
- 1994Market life expectancy as a risk filter
- 1994Score industrial and transport sync before calling an intermediate-trend signal
- 1997A 1995 industrial-average breakout mapped from component trends
- 1998Confirm Dow trends with Market breadth and Head and shoulders
- 1999Confirming an equity idea with rate, commodity, and index spreads
- 2001Why trend, range, and Dow rules need separate tests
- 2001Bear-market confirmation via prior correction troughs
- 2002Constructing a Dow line before breakout confirmation
- 2002Two-average confirmation as a swing-by-swing classroom drill
- 2002Withhold the hypothesis until the second average confirms: a 2001 case
- 2002A primary-bear case study in cycle speed, Dow theory, and pattern legs
- 2003Four index proxies as a bear-regime dashboard
- 2004Dual-average confirmation at shared prior highs
- 2004Confirmation as the second clock on a trend break
- 2004The confirmation-reaction planning window after a joint break
- 2005Dow confirmation as a two-average trend test
- 2008Related-average confirmation lag after a correction
- 2008Intermediate confirmation outranks secular phasing
- 2012Align swings to nested energy regimes
- 2016From nonconfirmation to a bearish primary trend change