2015issue C1240-44
Evaluating next-session intermarket range forecasts
A historical review compared a printed next-session high and low with the bar that followed. The useful check is whether that range holds once the session completes, and whether a printed extreme is then used only as a stop bound inside a trend that is already identified.
- A next-session range is a forecast of the following day's expected high and low, not a plot of prices that have already printed.
- Walk-forward overlay judges that print by placing the next completed bar on the prior forecast, rather than scoring only in-sample history.
- Intermarket analysis first identifies which related markets most influence a target, then a trend filter is built from moving averages and other predictive series.
- In the archive example, a predicted high was the reference for a stop-loss exit on a short in a downtrend, not an automated entry.
A printed next-session range
The archive describes a forecasting package that printed a next-session range, meaning the following day's expected high and low. That print was presented as different from charting tools that only plot current and historical prices. The review compared the prior session's predicted high and low with the next completed session on an e-mini S&P 500 chart.
Walk-forward overlay as the check
A prior accuracy protocol asked whether a price prediction fell inside a moving average of price. The later review instead used walk-forward overlay. It judged the forecast by placing the next completed bar on top of the prior print, rather than scoring the print only on in-sample history.
Intermarket screening then a trend filter
Intermarket analysis here meant reading prices and related series from several markets to judge which of them most influence a chosen target. Screening identified those related markets first. A neural-network search then selected moving-average combinations and other predictive series for short-, medium-, and long-term studies.
The reviewer treated the tool as a trend-forecasting aid with leading-type indicators. A leading-type indicator is a series built to anticipate short-term extremes or trend turns rather than to confirm them after the bar closes. The reviewer did not treat the tool as an automated system that emits entries, exits, or risk rules.
Each new release retrained the networks on recent history across equities, futures, foreign exchange, and exchange-traded funds. The edition covered a wide market list and offered a scanner with user-chosen filters for trend direction, strength, momentum, possible turns, and next-day extremes. A trend filter in this setting is a quantitative readout of direction, strength, or a possible turn over a stated sampling interval and lookback.
A predicted high as a stop bound
In a downtrend example, the predicted high was used as the reference level for a buy-stop exit on a short position. That use is a stop-loss: a pre-set exit that bounds loss or exposure while a position is open. The archive records that printed extreme as an exit reference on an open short, not as an automated entry.
Next-session printed range versus the completed bar
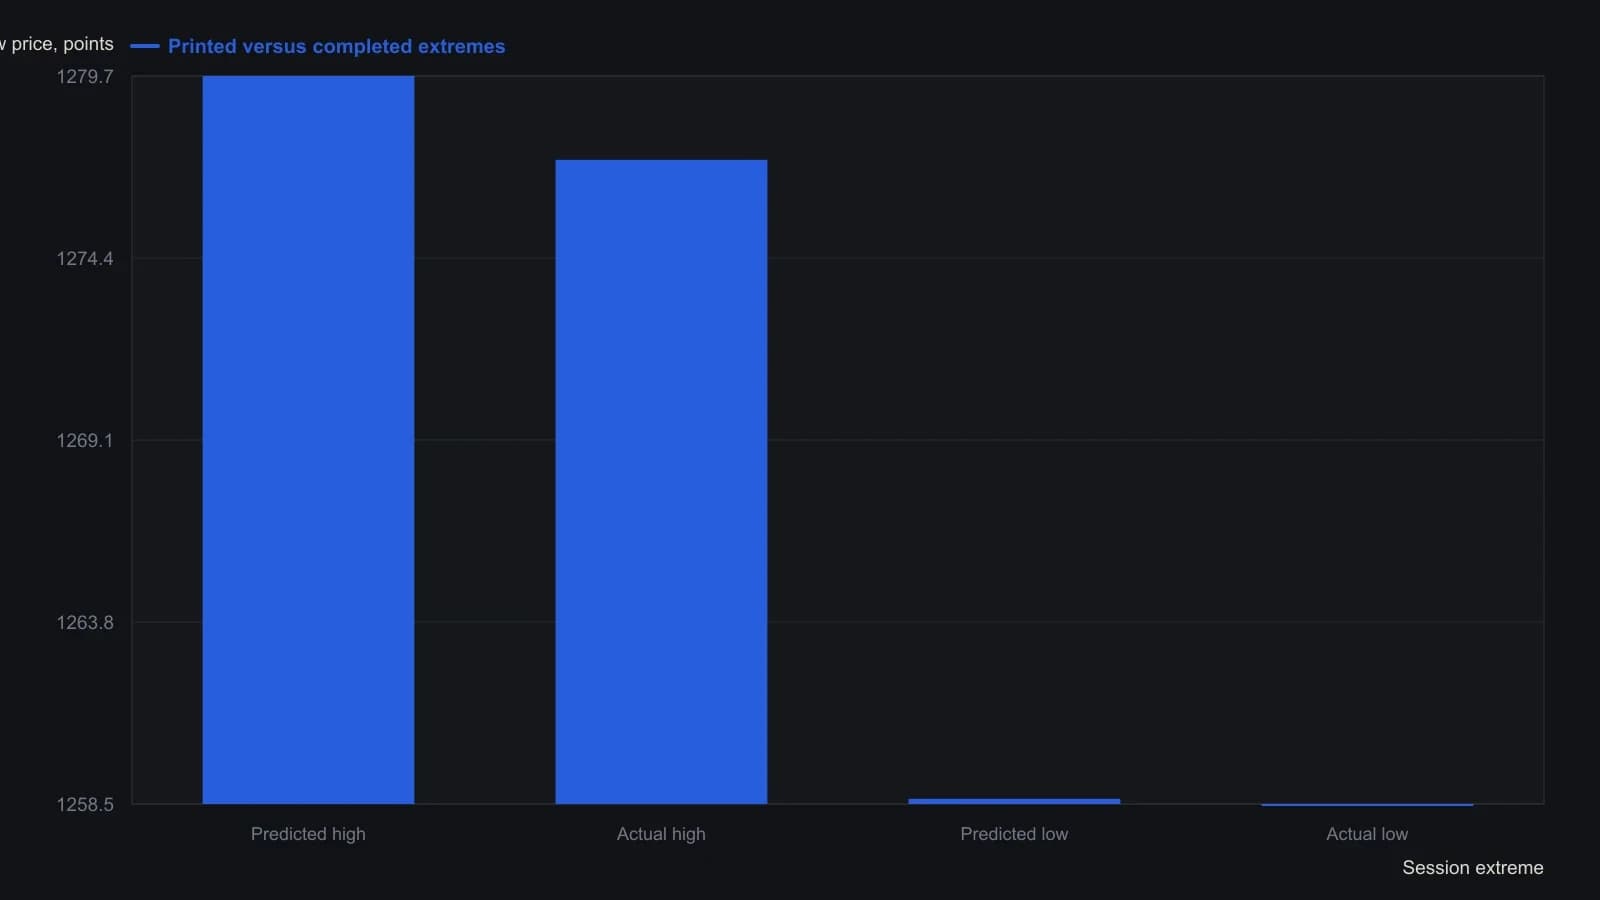
Single-session walk-forward overlay only. The review does not publish a multi-day hit rate for this check.
Listing defects and unchanged forecasts
The reviewer recorded print-layout defects in data listings and stated those defects did not change the forecast figures.
All readings on this track · 33 readings
- 1988Opening-range brackets, a two-bar trend filter, and bounded stops
- 1990Bezier-curve price trend filter
- 1992Constructing a damping-index trend filter
- 1992Building a random walk index trend filter
- 1992Phase diagrams for moving-average trend filters
- 1993Volume-weighted change smoothing and trend ranking
- 1993Concurrent highest-low filter with a largest-low-fall trigger
- 1994Unit-invariant trend filters and the c-test
- 1995Constructing cup and cap entries with a three-bar net line
- 1997Why a daily timing evaluation depends on interval, lookbacks, and the fitting objective
- 2001A volume budget clock for trend-segment construction
- 2001Keep three jobs separate when you test a composite score
- 2002Evaluating the weekly four-percent close filter as a market-state procedure
- 2003Constructing a confirmed zigzag trend filter
- 2004Decompose high, low, and close into separate forecast streams
- 2005Three-state moving-average breakout bar coloring
- 2005Constructing a volume and move-adjusted trend filter
- 2005A fifty-day average breakout as a trend permission filter
- 2005Current-bar inclusion can mute a stochastic channel break
- 2006A stochastic oscillator gated by a long-term exponential average
- 2010A construction test for a modified volume-price trend filter
- 2011Constructing a Spearman rank trend filter
- 2013Constructing a repeated-median slope as a resistant trend filter
- 2014Combining a relative-strength index and trend filters for oversold setups
- 2014Price-rooted lookbacks for a relative strength index, a moving average, and a trend filter
- 2015Evaluating next-session intermarket range forecasts
- 2018Read the intermarket weight matrix first, then the predicted moving-average filter
- 2018Constructing the stiffness trend filter from moving-average holds
- 2018The averaging kernel and the lagged trend gate are separate specifications
- 2019A trend filter is not ready to compare until portfolio constraints are written down
- 2019Lookback, threshold, and position-capacity for a stiffness trend-filter
- 2020Combining a trend filter with a moving average and a stochastic oscillator
- 2020Constructing a relative-strength oscillator with a rank-agreement trend filter