2003issue C071-2
A shared weekly-average grid for four Asian index proxies
A comparative case lined up country equity funds as proxies for Singapore, Hong Kong, Malaysia, and Japan and scored each series on the same 50-week and 200-week moving averages. Holdings inside those proxies then showed different sector mixes behind neighboring weekly breaks.
- Four country equity funds were used as index proxies for Singapore, Hong Kong, Malaysia, and Japan so the four series could share one weekly grid.
- Each proxy was scored against the same 50-week and 200-week moving averages, which let a local break be compared with neighboring regimes.
- Bank exposure dominated the Singapore proxy, while the Hong Kong proxy mixed real estate with capital goods, banks, and utilities.
- The Malaysia proxy slipped beneath both weekly averages in late fall 2002 but stayed close to those lines, which the case treated as relatively stronger behavior versus its neighbors.
One grid for four country proxies
A comparative case lined up four country equity funds as proxies for Singapore, Hong Kong, Malaysia, and Japan.
Each proxy was scored against the same 50-week and 200-week moving averages.
How each proxy sat on the weekly averages
The Singapore proxy dropped below both weekly averages in late 2000. After a late-2001 rally it held above the 50-week average for a few months in 2002, then lost that average later in 2002.
The Hong Kong proxy lost both weekly averages early in 2001 after late-2000 weakness. It recaptured the 50-week average by summer 2002 and fell back below it by fall 2002.
After a late-2000 decline, the Malaysia proxy rose above both weekly averages in fall 2001. It then slipped beneath them in late fall 2002 while remaining close to those lines.
The Japan proxy remained in a multi-year decline. The late-2000 break below both weekly averages was treated as another phase rather than a resolved low.
After first-half 2002 rallies, the compared Asian markets had not moved meaningfully below prior long-term lows dated to autumn 2001 for Hong Kong and Singapore and early 2002 for Japan.
Sector concentration in neighboring proxies
Bank exposure dominated the Singapore proxy, with the three largest holdings near 16 percent, 15 percent, and 11 percent and banks as a group near 43 percent.
The Hong Kong proxy mixed real estate near 27 percent with capital goods, banks, and utilities, and its two largest holdings were near 16 percent and 12 percent.
The Malaysia proxy kept its largest single holding near 9 percent.
Editorial note: sector concentration is the weight of a few industries or names inside a country proxy that can shape how that proxy tracks the local market. TradersWeek reads the bank-heavy Singapore mix and the Hong Kong mix of real estate, capital goods, banks, and utilities as one reason two neighbors can lose the same 50-week average for different structural reasons.
Relative strength in a weak regional set
In a weak regional set, the Malaysia proxy staying close beneath the weekly averages after that late-2002 slip was treated as relatively stronger behavior versus its neighbors.
Editorial note: relative-strength context here means judging one market by how close it stays to the shared averages versus weaker neighbors. The archive already used that reading for Malaysia after the late-2002 slip, while it treated the Japan proxy’s late-2000 break as another phase of a multi-year decline rather than a resolved low.
EWM weekly close versus the 50-week and 200-week averages
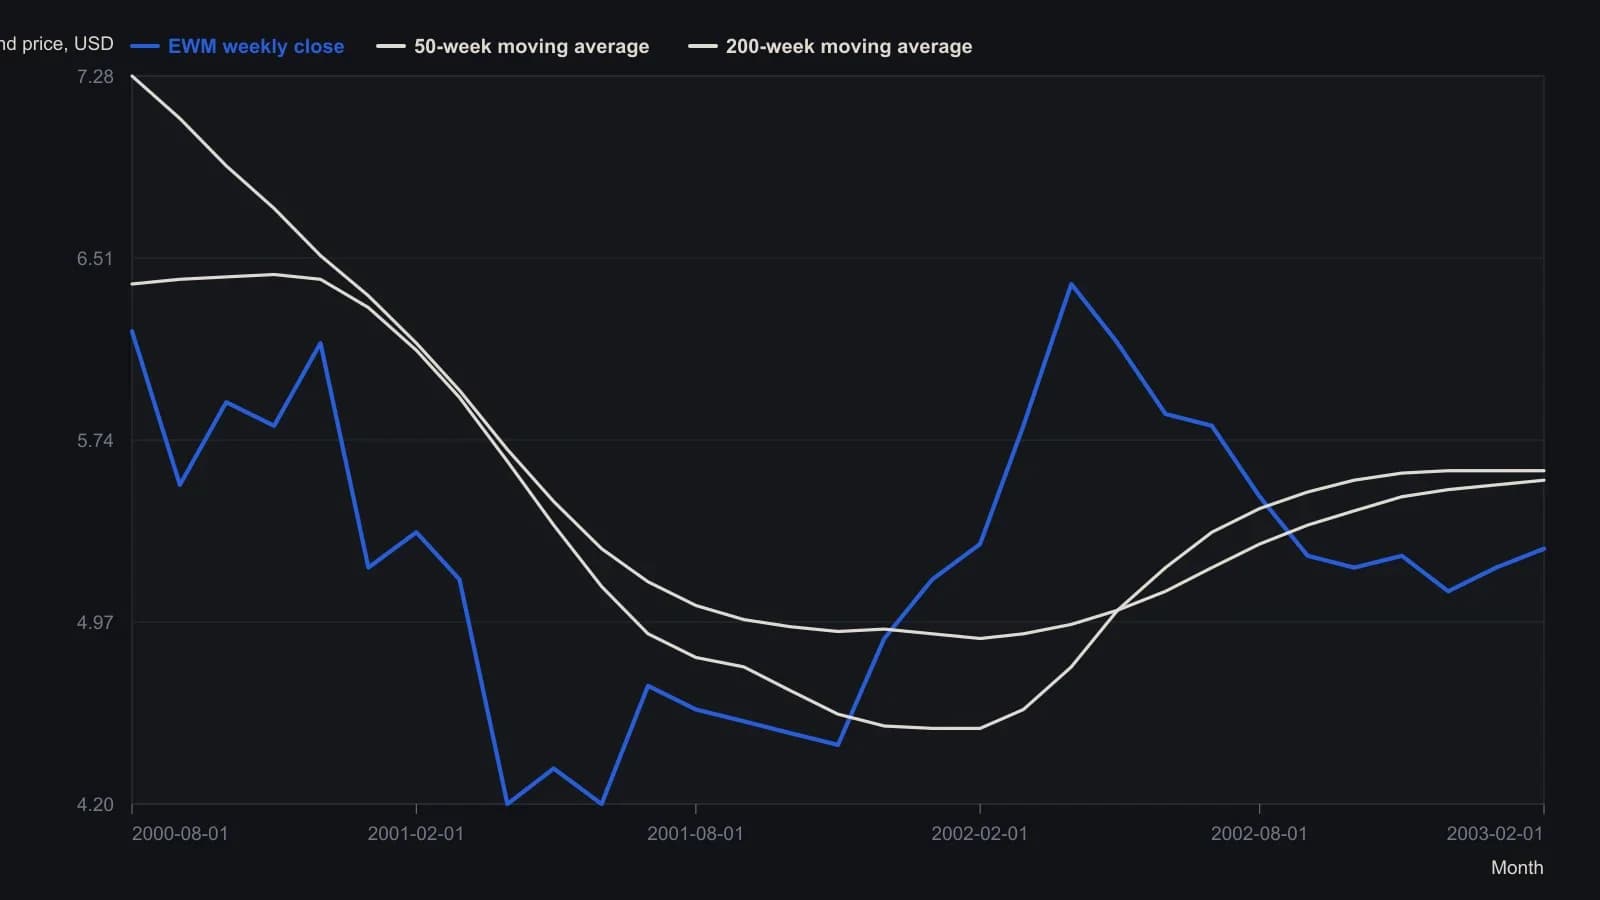
Monthly samples from weekly bars on the printed chart. The faster green trace is the 50-week average; the slower purple trace is the 200-week average. Raster readings are approximate except for the three labeled endpoint prints.
All readings on this track · 19 readings
- 1992Country regime inside global allocation and index proxies
- 1992Intermarket confirmation for long-duration bond-fund timing
- 1993Paired bond and currency proxies with weekly crossover confirmation
- 1995Walk-forward evaluation of a municipal futures timed fund switch
- 1999Regime-gated allocation with bounded index leverage
- 1999Testing trend following with cash-price controls
- 2002A capital-preservation case for index-proxy allocation
- 2003A shared weekly-average grid for four Asian index proxies
- 2005Index-etf-core weights, a growth-index-clock, and an implementation-cost-ledger
- 2005European index proxies as one weekly-regime panel
- 2006Index-fund proxies as intermarket regime instruments
- 2006Constructing metal option exposure with mining proxies and implied volatility
- 2010Matched straddles on levered versus unlevered index proxies
- 2013Inheritance as an index-proxy and allocation case
- 2014Headline index levels mix a changing basket with a changing divisor
- 2017Screening ETFs by liquidity, index fit, and rank
- 2019Leveraged commodity proxies fail the futures test
- 2020Constructing pre-listing paths for new fund sleeves
- 2020A sleeve after cost-drag, judged by an index-proxy, sized in a stock-bond mix