2017issue C0914-17
Two-wave monthly cycles as a regime filter
Over a 20-year SPY sample, first-of-month-indexed closes and average daily volume both formed two upward waves, near mid-month and near month-end. TradersWeek's editorial reading is to confirm that shared shape first, then keep the late-month window only as a monthly-cycle-filter in front of a short-lookback mean-reversion model.
- First-of-month-indexed SPY closes and average daily volume both showed two intra-month upward waves, one near mid-month and one near month-end, on calendar-date and trading-date axes.
- The cash-flow-rebalancing-hypothesis treats scheduled pension-fund inflows, a few days of rebalancing, no shorting, and a substantial equity sleeve as the reason those price and volume waves line up.
- Long and short day-hold-cluster maps placed late-month buying on calendar days 20-28 and placed opposing short clusters earlier in each half of the month.
- TradersWeek's editorial reading is to keep that late window as an abstention layer in front of short-lookback relative-strength-index and bollinger-bands entries, and to leave a five-day breakout in the same test as a mismatch check.
Price and volume share the same intra-month shape
Over a 20-year SPY sample, first-of-month-indexed closes showed two upward waves, one near mid-month and one near month-end. The same two-wave shape appeared on both the calendar-date axis and the trading-date axis.
Average SPY daily volume over that same 20-year span also formed two intra-month waves aligned with the price waves. Lunar-phase explanations were set aside because they did not account for a two-wave intra-month price shape.
The cash-flow-rebalancing-hypothesis
The working mechanism was scheduled pension-fund cash inflows, a few days to rebalance, no shorting, and a substantial equity sleeve described as generally 20% to 80%. That timetable is the cash-flow-rebalancing-hypothesis: scheduled institutional inflows force equity purchases on a twice-monthly timetable and therefore leave aligned price and volume footprints.
Day-hold-cluster maps from a seasonal-trading grid
Seasonal-trading is a single testable procedure that treats day-of-month location as a rule input so entry, holding period, and abstention are evaluated together.
A long grid that bought the close on each calendar day and held one to eight days produced two day-hold-cluster groups: days 7-12 with four-to-eight-day holds, and days 20-28 with five-to-eight-day holds.
A short grid that sold the close on each calendar day and held one to eight days produced two day-hold-cluster groups: days 2-7 with two-to-six-day holds, and days 15-23 with one-to-five-day holds.
A monthly-cycle-filter in front of short-lookback entries
Three eight-day-hold entries were then applied to 20 years of SPY daily data. Relative-strength-index is a short-lookback bounded oscillator of closes; the version used here bought when the five-observation reading dropped below 30. Bollinger-bands is a volatility envelope around a moving average; the version used here bought on a cross through the lower band of lookback 10 and width 2, used here as a strength-confirmation buy condition. The third entry was a close through the prior five-day high.
Those same entries were also tested with a monthly-cycle-filter that allowed trades only from the 20th through the 28th of the month. A monthly-cycle-filter is a calendar constraint that lets an otherwise complete entry rule fire only inside pre-specified day-of-month windows.
TradersWeek's editorial reading is to use those windows only as an abstention layer in front of the short-lookback mean-reversion model.
A breakout rule as a mismatch check
The five-day breakout was retained as a contrast because a broad average was described as mean-reverting.
TradersWeek's editorial reading is to keep that breakout rule in the same test as a mismatch check on an averaged instrument.
Cycle filter versus no filter: average trade on 20-year SPY tests
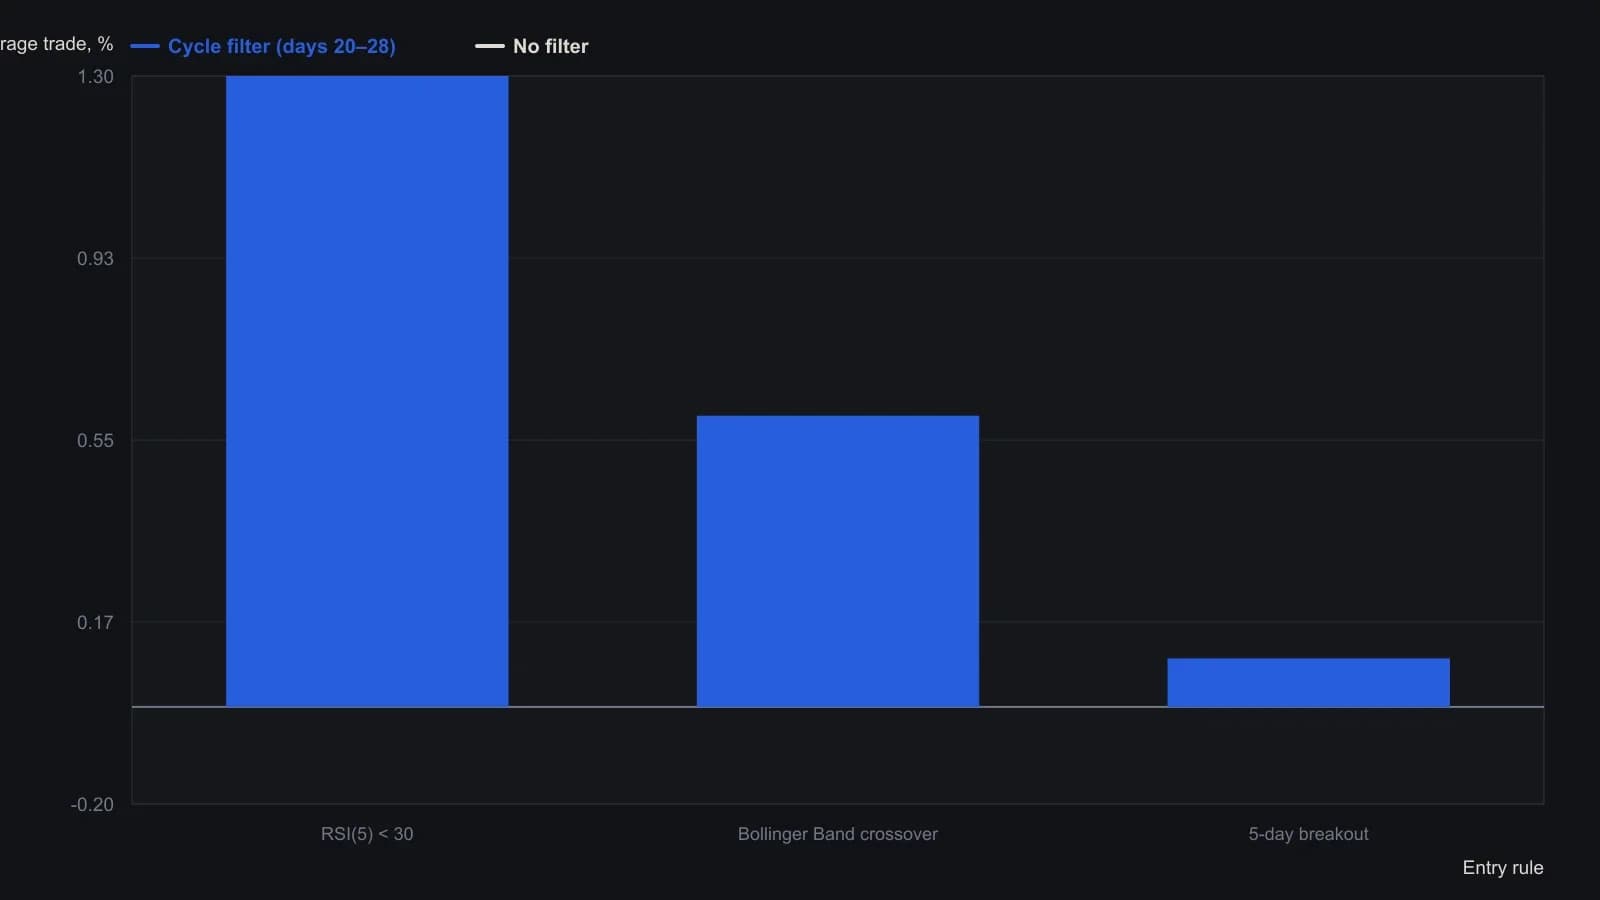
The cycle filter limits entries to the 20th through the 28th of the month; every rule holds eight days. Figure 6 labels the middle rule Bollinger Band (20,2) even though the trading-plan section specifies (10,2).
All readings on this track · 45 readings
- 1992Constructing volatility-scaled bands with relative strength index confirmation
- 1994Implied volatility as a band-defined regime filter for index options
- 1995Constructing projection bands from least-squares slopes
- 1995Constructing regression projection bands and range oscillators
- 1996Constructing Bollinger bands, percent-b, and stochastics
- 1996Constructing mechanical rules from Bollinger Bands and stochastics
- 1996Constructing a standard-error envelope around a linear regression
- 1996Dual-horizon ratio envelopes and regression error channels
- 1997Rational group structure with a trend screen, RSI, and bands
- 1997Asymmetric volatility band construction
- 1998Constructing three-state filters from Bollinger band envelopes
- 1999Combination filters with Bollinger Bands and the relative strength index
- 1999Constructing stochastic timed exits and band-RSI reversals
- 1999Evaluating Bollinger Bands against fixed-width and range-based envelopes
- 2000Constructing a Bollinger Band target as a forward price
- 2001Numeric candlestick encoding with local size bands
- 2001Ranked candlestick sentiment to band-cross entries
- 2002Combining Bollinger Bands, RSI, and a stop-loss
- 2002Bollinger Bands remain filters, not forecasts
- 2002Constructing a stochastic RSI with Bollinger bands
- 2002Constructing a StochRSI and Bollinger mechanical system
- 2003Constructing volatility-scaled Bollinger envelopes
- 2003Why tick breadth fails as a market personality
- 2005Constructing Bollinger bands versus fixed trading bands
- 2006Squared versus absolute deviation in envelope construction
- 2006Confirming yen crossovers with implied volatility and bands
- 2006A daily candle reversal is a hypothesis until shorter sessions fail at the same zone
- 2008Rebuild the Relative Strength Index as price-scale bands
- 2008Reading Relative Strength Index extremes on one price axis with Bollinger Bands and moving averages
- 2011Three-filter confirmation for short-swing futures
- 2011Constructing an inverse Fisher stochastic with bands and averages
- 2012Constructing a Bollinger Band indicator suite
- 2012Stacking price extremes, crossovers, bands, and MACD
- 2012Adaptive Bollinger band impulse, trend, and momentum filters
- 2013Rescaling stochastic, percent-B, and wave-count parameters
- 2014Industry-group quartile pivots as a Bollinger Bands case study
- 2014Bollinger Bands as adaptive price envelopes: a 2014 classroom case
- 2016Trend-channel entry rules from stacked moving averages
- 2016A permission stack for Bollinger, RSI, and the 50-period average
- 2017Constructing weighted Bollinger bands and volume averages
- 2017Four swing-entry rules that share a timed exit
- 2017Two-wave monthly cycles as a regime filter
- 2019Constructing exponential-deviation-bands from a midline-average
- 2020Critiquing exponential variants of Bollinger Bands
- 2020Constructing selectable volatility and moving-average bands