2000issue C071-5
Constructing a Bollinger Band target as a forward price
A band-target construction restates a two-standard-deviation, 30-period Moving average penetration rule as the unknown next price that would make the close sit on the band. Because that unknown price also enters the standard-deviation term, the equality is a quadratic that can have one solution, two solutions, or no solution.
- A band-target construction restates a two-standard-deviation, 30-period Moving average penetration rule as the unknown next price that would make the close sit on the band, so the system can plot the trigger instead of guessing it.
- The unknown price enters both the Moving average and the standard-deviation term, so the band-penetration equality is a quadratic that can have one solution, two solutions, or no solution.
- When the band retreats faster than price can reach it, the quadratic has no real root, the penetration rule is locked out, and the system cannot fire that period's signal.
- Unsolved or hidden lockouts suppress later trades and inject error into any backtest, so unusually wide Bollinger Bands or unusually short Moving average lengths need to be checked before System optimization.
Restate the penetration as a forward target
A band-target construction restates a two-standard-deviation, 30-period Moving average penetration rule as the unknown next price that would make the close sit on the band. The system can then plot the trigger instead of guessing it.
The unknown price makes a quadratic
Because the unknown price enters both the Moving average and the standard-deviation term, the band-penetration equality is a quadratic. That quadratic can have one solution, two solutions, or no solution.
Lockout and a misleading single root
When the band retreats faster than price can reach it, the quadratic has no real root. The penetration rule is locked out, and the system cannot fire that period's signal.
A single-root case can still mislead a system if price later moves past the contact point. The construction then behaves as if the band was never reached.
Step the unknown price
The supplied construction finds the first feasible root by stepping the unknown price in 0.01 increments. It rebuilds the average and standard deviation at each step until the distance to the band is zero or stops shrinking.
Coarser step sizes speed the nested-loop search but reduce the accuracy of the solved target price.
Upper-band and lower-band targets are computed as separate procedures so the sign of the distance test and the direction of the price step stay consistent with each band.
What the construction returns
If a root exists the construction returns the target price, its percent change from the last close, and a flag of 1. If lockout occurs it returns the closest vertex price, the matching percent change, and a flag of 0.
Unsolved or hidden lockouts do not only suppress later trades. They also inject error into any backtest of the band-penetration system.
Archive testing associates lockout with unusually wide bands or unusually short Moving average lengths. Those construction choices need to be checked before a system is optimized.
Dow Industrials daily price with Bollinger Bands and the lower-band target
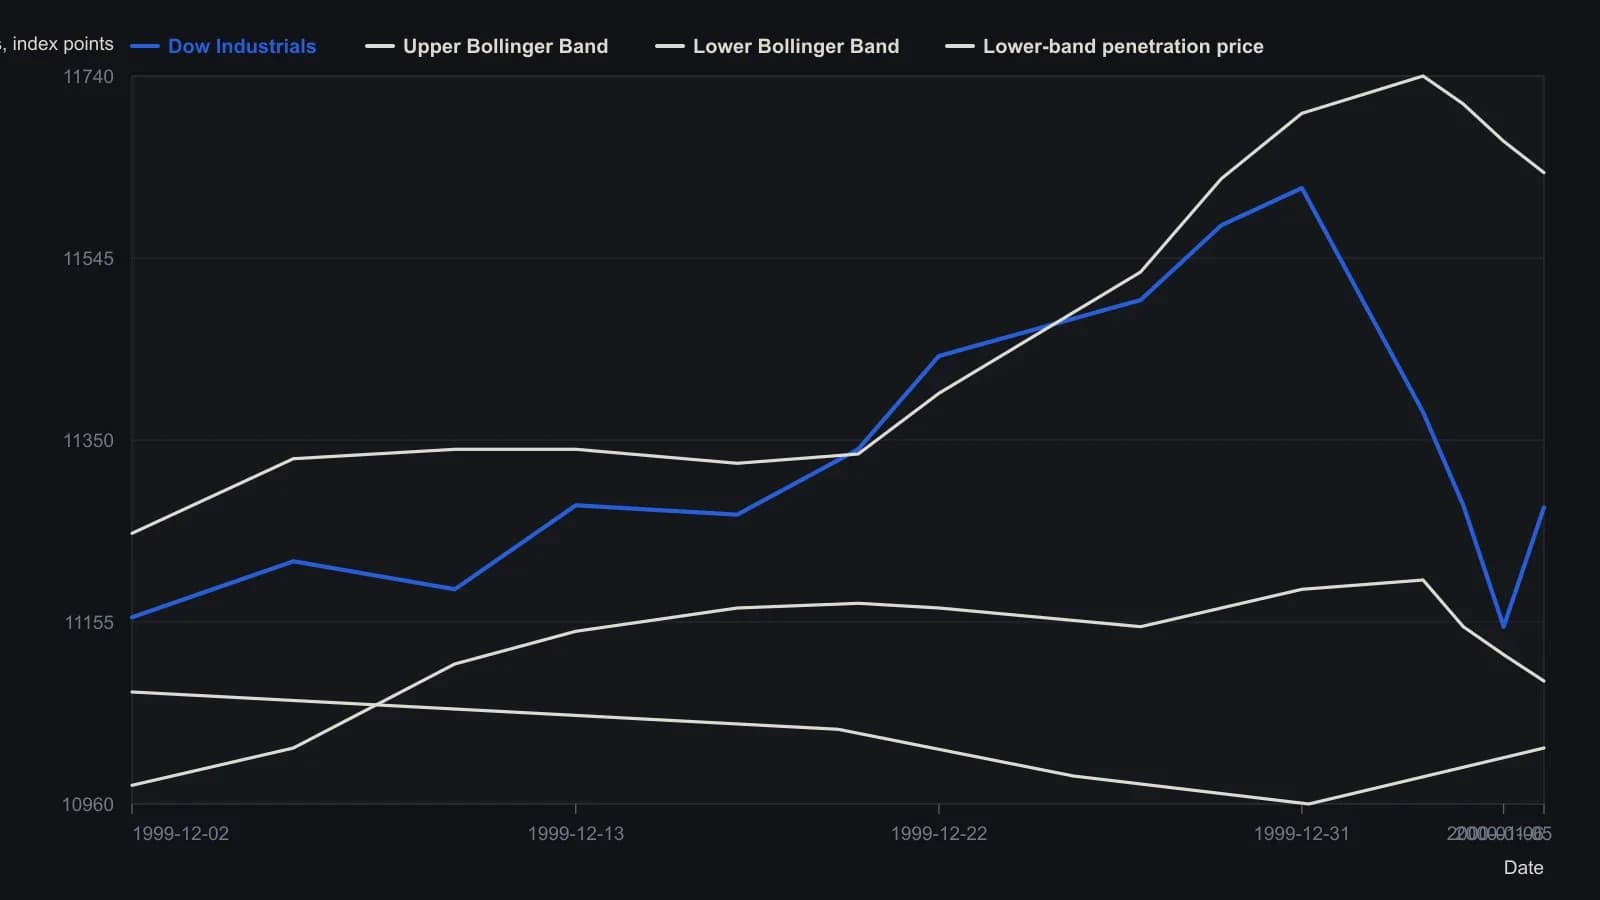
Cotton computes the Top StdDev Bogie only on the last five sessions and prints 11696.95 for 6 January; those upper penetration prices sit off the visible 10900–11900 scale. Digitized points before the last bar are approximate to the nearest ten index points. The sidebar simulator defaults to length 15, two standard deviations and a one-cent step; the prose rule cites a 30-day average.
All readings on this track · 45 readings
- 1992Constructing volatility-scaled bands with relative strength index confirmation
- 1994Implied volatility as a band-defined regime filter for index options
- 1995Constructing projection bands from least-squares slopes
- 1995Constructing regression projection bands and range oscillators
- 1996Constructing Bollinger bands, percent-b, and stochastics
- 1996Constructing mechanical rules from Bollinger Bands and stochastics
- 1996Constructing a standard-error envelope around a linear regression
- 1996Dual-horizon ratio envelopes and regression error channels
- 1997Rational group structure with a trend screen, RSI, and bands
- 1997Asymmetric volatility band construction
- 1998Constructing three-state filters from Bollinger band envelopes
- 1999Combination filters with Bollinger Bands and the relative strength index
- 1999Constructing stochastic timed exits and band-RSI reversals
- 1999Evaluating Bollinger Bands against fixed-width and range-based envelopes
- 2000Constructing a Bollinger Band target as a forward price
- 2001Numeric candlestick encoding with local size bands
- 2001Ranked candlestick sentiment to band-cross entries
- 2002Combining Bollinger Bands, RSI, and a stop-loss
- 2002Bollinger Bands remain filters, not forecasts
- 2002Constructing a stochastic RSI with Bollinger bands
- 2002Constructing a StochRSI and Bollinger mechanical system
- 2003Constructing volatility-scaled Bollinger envelopes
- 2003Why tick breadth fails as a market personality
- 2005Constructing Bollinger bands versus fixed trading bands
- 2006Squared versus absolute deviation in envelope construction
- 2006Confirming yen crossovers with implied volatility and bands
- 2006A daily candle reversal is a hypothesis until shorter sessions fail at the same zone
- 2008Rebuild the Relative Strength Index as price-scale bands
- 2008Reading Relative Strength Index extremes on one price axis with Bollinger Bands and moving averages
- 2011Three-filter confirmation for short-swing futures
- 2011Constructing an inverse Fisher stochastic with bands and averages
- 2012Constructing a Bollinger Band indicator suite
- 2012Stacking price extremes, crossovers, bands, and MACD
- 2012Adaptive Bollinger band impulse, trend, and momentum filters
- 2013Rescaling stochastic, percent-B, and wave-count parameters
- 2014Industry-group quartile pivots as a Bollinger Bands case study
- 2014Bollinger Bands as adaptive price envelopes: a 2014 classroom case
- 2016Trend-channel entry rules from stacked moving averages
- 2016A permission stack for Bollinger, RSI, and the 50-period average
- 2017Constructing weighted Bollinger bands and volume averages
- 2017Four swing-entry rules that share a timed exit
- 2017Two-wave monthly cycles as a regime filter
- 2019Constructing exponential-deviation-bands from a midline-average
- 2020Critiquing exponential variants of Bollinger Bands
- 2020Constructing selectable volatility and moving-average bands