2011issue C0547-54
Three-filter confirmation for short-swing futures
A crowded overlay can issue buy and sell prompts at the same time and freeze the entry-or-exit decision. The described stack keeps three tools, with Bollinger Bands as the trend reader and MACD plus the Relative Strength Index as confirmation. Editorial reading: apply that order as a confirmation ladder, then assign a separate playbook for trend, range, or the transitional open.
- Limit the stack to three tools so a crowded overlay cannot issue buy and sell prompts at the same time and freeze the decision.
- Read Bollinger Bands first as trend confirmation: outer-band slope and a price walk mark an intact trend, and flattening or reversal marks the end of the move.
- Require MACD and Relative Strength Index agreement, including the zero-line filter, before a long or short is considered.
- Keep separate playbooks for trending, sideways, and transitional-open conditions, and let session-scale readings override a contrary daily directional bias.
Why a crowded overlay freezes the decision
A crowded indicator overlay can issue buy and sell prompts at the same time, which freezes the entry-or-exit decision. The described stack is limited to three tools, with Bollinger Bands as the primary trend reader and MACD plus the Relative Strength Index used as confirmation.
Editorial reading: treat those jobs as a confirmation ladder. Read Bollinger Bands first, require MACD and Relative Strength Index agreement second, and only then assign the matching playbook. Combining the three tools is presented as a way to mark when a short-horizon trend starts and when it ends.
Read Bollinger Bands as trend confirmation
Bollinger Bands are treated as trend confirmation rather than fade-the-touch signals. A lower band sloping down at about 45 degrees or steeper with price walking it marks a downtrend, and the symmetric upper-band walk marks an uptrend. Flattening or reversal of that outer band marks the end of the move.
On intraday bars the described Bollinger setup uses a 12-period moving average and two standard deviations, a shorter lookback than the 18-to-21-period daily convention.
Require MACD and Relative Strength Index agreement
A 7-period Relative Strength Index holding above 70 is treated as an intact uptrend, while a drop back through 70 is treated as a warning that the uptrend is weakening. The 30 threshold plays the symmetric role in downtrends.
MACD is applied with the 12-26-9 defaults, but a long is considered only after a cross above the signal line that also sits above zero, and a short only when the line is below both the signal and zero. That is the zero-line filter: MACD must sit on the same side of zero as the intended trade.
Assign a playbook instead of one hybrid rule
Separate playbooks are kept for trending, sideways, and opening transitional conditions rather than forcing one hybrid rule onto every tape. The transitional open is the first minutes of the session, when trend and range are not yet resolved.
Session-scale readings from the three-filter stack can override a contrary daily directional bias. The hold itself is a short-swing: an intraday hold measured in minutes rather than a multi-day position.
Let range bars set the sampling clock
Fixed-width range bars, illustrated as a two-point increment on equity-index futures, drop clock time so the same three indicators update on volatility rather than on minutes.
Editorial note: range bars change the sampling clock. They do not change the confirmation order or replace the separate playbooks for trend, range, and the transitional open.
Euro futures on 16-tick range bars, 22 September 2009
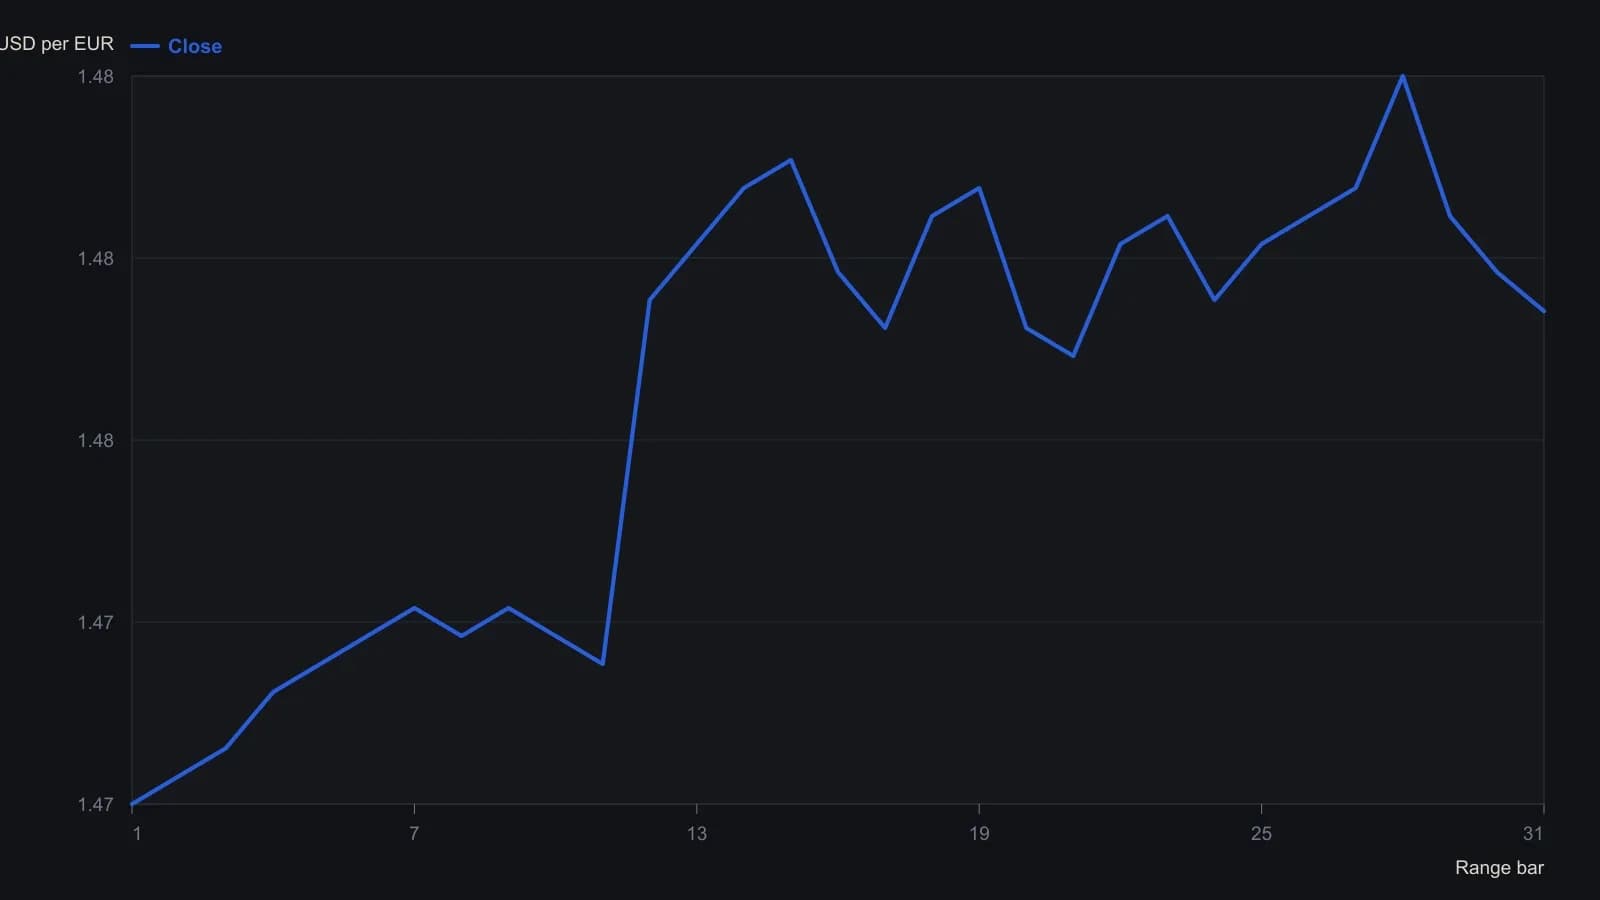
High minus low is fixed on these range bars, so the breakout prints as a thin stacked column; closes inside that column were not separately readable and are omitted rather than interpolated. Digitized prices are rounded to 0.0005 except the labeled last print.
All readings on this track · 45 readings
- 1992Constructing volatility-scaled bands with relative strength index confirmation
- 1994Implied volatility as a band-defined regime filter for index options
- 1995Constructing projection bands from least-squares slopes
- 1995Constructing regression projection bands and range oscillators
- 1996Constructing Bollinger bands, percent-b, and stochastics
- 1996Constructing mechanical rules from Bollinger Bands and stochastics
- 1996Constructing a standard-error envelope around a linear regression
- 1996Dual-horizon ratio envelopes and regression error channels
- 1997Rational group structure with a trend screen, RSI, and bands
- 1997Asymmetric volatility band construction
- 1998Constructing three-state filters from Bollinger band envelopes
- 1999Combination filters with Bollinger Bands and the relative strength index
- 1999Constructing stochastic timed exits and band-RSI reversals
- 1999Evaluating Bollinger Bands against fixed-width and range-based envelopes
- 2000Constructing a Bollinger Band target as a forward price
- 2001Numeric candlestick encoding with local size bands
- 2001Ranked candlestick sentiment to band-cross entries
- 2002Combining Bollinger Bands, RSI, and a stop-loss
- 2002Bollinger Bands remain filters, not forecasts
- 2002Constructing a stochastic RSI with Bollinger bands
- 2002Constructing a StochRSI and Bollinger mechanical system
- 2003Constructing volatility-scaled Bollinger envelopes
- 2003Why tick breadth fails as a market personality
- 2005Constructing Bollinger bands versus fixed trading bands
- 2006Squared versus absolute deviation in envelope construction
- 2006Confirming yen crossovers with implied volatility and bands
- 2006A daily candle reversal is a hypothesis until shorter sessions fail at the same zone
- 2008Rebuild the Relative Strength Index as price-scale bands
- 2008Reading Relative Strength Index extremes on one price axis with Bollinger Bands and moving averages
- 2011Three-filter confirmation for short-swing futures
- 2011Constructing an inverse Fisher stochastic with bands and averages
- 2012Constructing a Bollinger Band indicator suite
- 2012Stacking price extremes, crossovers, bands, and MACD
- 2012Adaptive Bollinger band impulse, trend, and momentum filters
- 2013Rescaling stochastic, percent-B, and wave-count parameters
- 2014Industry-group quartile pivots as a Bollinger Bands case study
- 2014Bollinger Bands as adaptive price envelopes: a 2014 classroom case
- 2016Trend-channel entry rules from stacked moving averages
- 2016A permission stack for Bollinger, RSI, and the 50-period average
- 2017Constructing weighted Bollinger bands and volume averages
- 2017Four swing-entry rules that share a timed exit
- 2017Two-wave monthly cycles as a regime filter
- 2019Constructing exponential-deviation-bands from a midline-average
- 2020Critiquing exponential variants of Bollinger Bands
- 2020Constructing selectable volatility and moving-average bands