2006issue C131-5
A daily candle reversal is a hypothesis until shorter sessions fail at the same zone
A candlestick signal on a daily or longer chart is not confirmed until that session closes, so the wait can miss the move or worsen the entry. The archive workflow keeps the daily candle as the thesis and asks a shorter session, a stochastic-oscillator cross, and the upper Bollinger Band to fail at the same resistance zone before treating the turn as a stronger hypothesis.
- A candlestick uses only a session's open, high, low, and close, so the same body and shadow reading applies from an intraday interval through monthly charts.
- A daily or longer candle signal is not confirmed until that session closes, and waiting for the close can miss the move or worsen the risk/reward of the entry.
- The archive treated a lean-hogs bearish engulfing against resistance as a stronger turn when a first-hour stochastic-oscillator cross stayed below a prior peak and the candle high held the upper Bollinger Band.
- A 15-minute bearish engulfing at the highs plus a falling window was used to confirm reversal and continuation earlier than the daily close.
What a candlestick records
A candlestick is built from the same open, high, low, and close as a bar. The real body is the open-close range. It is filled when the close is lower and empty when the close is higher. The shadows mark the session high and low.
Candle lines can be drawn on any session length, from an intraday interval through daily, weekly, and monthly charts, because each line uses only that period's open, high, low, and close.
A long empty real body is read as buyers in control. A long filled real body is read as sellers in control. A small real body is read as a tug of war that may be losing momentum. A doji, a candle whose open and close are the same, is treated as a sign the market is tired.
The daily close arrives after the useful entry
A daily or longer candle signal is not confirmed until that session's close. Waiting for that confirmation can miss the move or worsen the risk/reward of the entry.
Intraday-end-of-day pairing uses a developing daily candle setup as the thesis, then reads shorter-session candles to time an earlier entry before the daily close confirms.
A bearish engulfing pattern is a two-candle reversal in an ascent in which a black real body envelops the prior white real body. It is read as supply immobilizing the bulls and as supply overwhelming demand.
One resistance zone, three confirming tools
On the February 2006 lean-hogs daily chart, a bearish engulfing pattern against resistance was treated as evidence that sellers had the upper hand.
The high of that bearish engulfing pattern tested and held the upper Bollinger Band. That hold was treated as a hint that the market was overextended to the upside. Bollinger Bands are used here as a volatility envelope around price, and a reversal candle that tests and holds the upper band was treated as evidence the market was overextended to the upside.
On the 60-minute lean-hogs chart, a first-hour downside stochastic-oscillator cross that stayed below the 28 November 2005 peak confirmed a bearish divergence from price. The stochastic oscillator is used here as a lookback oscillator of ordered price. It can confirm a candle reversal when it crosses down while remaining below a prior peak.
The worked example merged candle signals (spinning top, doji, bearish engulfing) with a resistance zone, stochastic divergence, and the top of the Bollinger Band. The archive treated that stack as a stronger turn hypothesis than any one tool alone.
Stochastic overbought failure on the resistance-test window
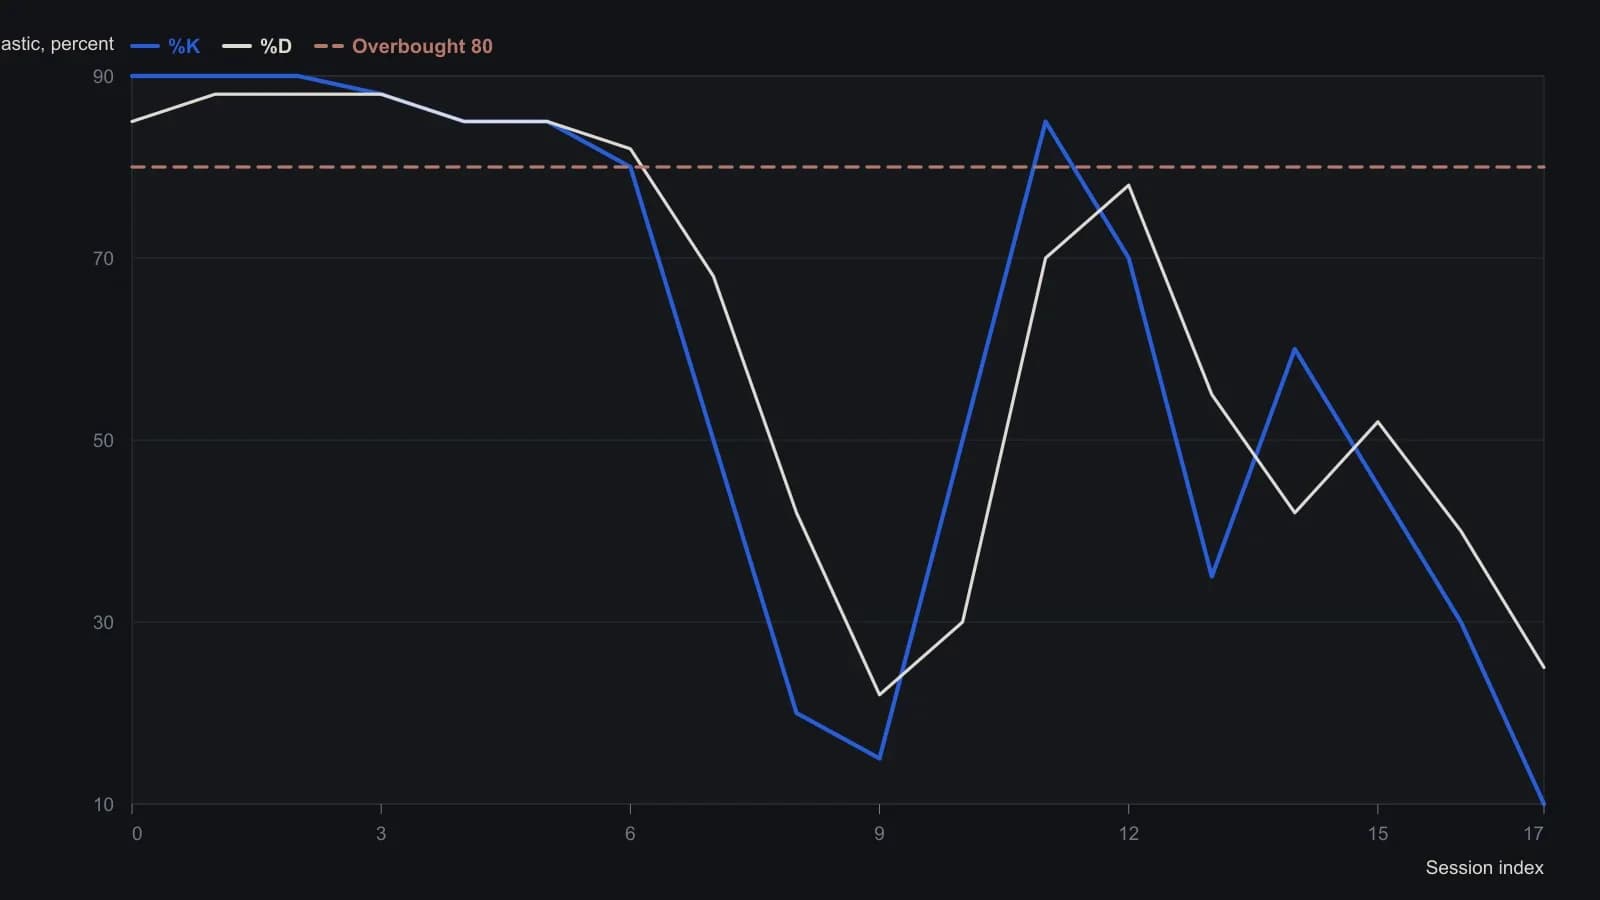
Dashed guides on the pane were read as the conventional 80 and 20 levels. The upper pane has no printed price scale, so candles and Bollinger values were not digitized. Each x step is an equal-width sample across the window, not every session.
A shorter session can confirm before the daily close
A 15-minute bearish engulfing at the highs, plus a following falling window, was used as earlier reversal and continuation confirmation than the daily close. A falling window is a gap down treated as a continuation signal in the direction of the window.
The sketched entry was near 67.90, with a target at the 21 November low of 64.60.
All readings on this track · 45 readings
- 1992Constructing volatility-scaled bands with relative strength index confirmation
- 1994Implied volatility as a band-defined regime filter for index options
- 1995Constructing projection bands from least-squares slopes
- 1995Constructing regression projection bands and range oscillators
- 1996Constructing Bollinger bands, percent-b, and stochastics
- 1996Constructing mechanical rules from Bollinger Bands and stochastics
- 1996Constructing a standard-error envelope around a linear regression
- 1996Dual-horizon ratio envelopes and regression error channels
- 1997Rational group structure with a trend screen, RSI, and bands
- 1997Asymmetric volatility band construction
- 1998Constructing three-state filters from Bollinger band envelopes
- 1999Combination filters with Bollinger Bands and the relative strength index
- 1999Constructing stochastic timed exits and band-RSI reversals
- 1999Evaluating Bollinger Bands against fixed-width and range-based envelopes
- 2000Constructing a Bollinger Band target as a forward price
- 2001Numeric candlestick encoding with local size bands
- 2001Ranked candlestick sentiment to band-cross entries
- 2002Combining Bollinger Bands, RSI, and a stop-loss
- 2002Bollinger Bands remain filters, not forecasts
- 2002Constructing a stochastic RSI with Bollinger bands
- 2002Constructing a StochRSI and Bollinger mechanical system
- 2003Constructing volatility-scaled Bollinger envelopes
- 2003Why tick breadth fails as a market personality
- 2005Constructing Bollinger bands versus fixed trading bands
- 2006Squared versus absolute deviation in envelope construction
- 2006Confirming yen crossovers with implied volatility and bands
- 2006A daily candle reversal is a hypothesis until shorter sessions fail at the same zone
- 2008Rebuild the Relative Strength Index as price-scale bands
- 2008Reading Relative Strength Index extremes on one price axis with Bollinger Bands and moving averages
- 2011Three-filter confirmation for short-swing futures
- 2011Constructing an inverse Fisher stochastic with bands and averages
- 2012Constructing a Bollinger Band indicator suite
- 2012Stacking price extremes, crossovers, bands, and MACD
- 2012Adaptive Bollinger band impulse, trend, and momentum filters
- 2013Rescaling stochastic, percent-B, and wave-count parameters
- 2014Industry-group quartile pivots as a Bollinger Bands case study
- 2014Bollinger Bands as adaptive price envelopes: a 2014 classroom case
- 2016Trend-channel entry rules from stacked moving averages
- 2016A permission stack for Bollinger, RSI, and the 50-period average
- 2017Constructing weighted Bollinger bands and volume averages
- 2017Four swing-entry rules that share a timed exit
- 2017Two-wave monthly cycles as a regime filter
- 2019Constructing exponential-deviation-bands from a midline-average
- 2020Critiquing exponential variants of Bollinger Bands
- 2020Constructing selectable volatility and moving-average bands