2014issue C0255
Industry-group quartile pivots as a Bollinger Bands case study
This case study teaches Bollinger Bands as a lookback envelope on ordered, normalized industry-group prices. Quartile ranks are specified first. Later overbought or oversold pivots are then read as an out-of-sample check on that envelope.
- Compare industry groups only after restating each series as a normalized group price, kept as daily open, high, low, and close observations.
- Specify a lookback and turn momentum ratios into quartile ranks before treating any later extreme as informative.
- A power shift is a change in group strength after an overbought or oversold condition; a pivot is the later reversion point.
- Editorial reading: use those later pivots as an out-of-sample check on the envelope, not as a live trading cue.
A group-level forecast envelope
Industry groups can be compared after prices are restated as a normalized group price within each group. Each group is carried as daily open, high, low, and close observations. A normalized group price restates those series onto a common scale so ranks and envelopes can be compared across industries.
Editorial interpretation: Bollinger Bands are taught here as a lookback envelope around a central tendency of those ordered prices. The envelope frames industry-group extremes as a forecast-style baseline. Students specify the sampling interval and lookback first, place the series into quartile ranks, and only then inspect later overbought or oversold pivots.
Momentum ratios and quartile ranks
Momentum can be specified as a momentum ratio, which is the current price divided by a prior price over the chosen sampling interval. Those ratios can be ranked or assigned to quartiles. A quartile rank is the peer placement of a group after that comparison, in one of four ordered buckets.
The same view can change the observation date, the chosen quartile, and whether the rank is short-term, intermediate-term, or long-term. A short-term rank is computed on the shortest of the available lookbacks and can sit beside the longer-horizon ranks. Short-term momentum can also be shown as a separate plotted series on the quartile-mover chart.
Quartile-mover, momentum-mover, and pivot displays
A quartile-mover view can list leading industry groups in several sortable categories. That view can be switched among quartile-mover, momentum-mover, and power-shift-and-pivot displays.
New first-quartile groups by daily price change
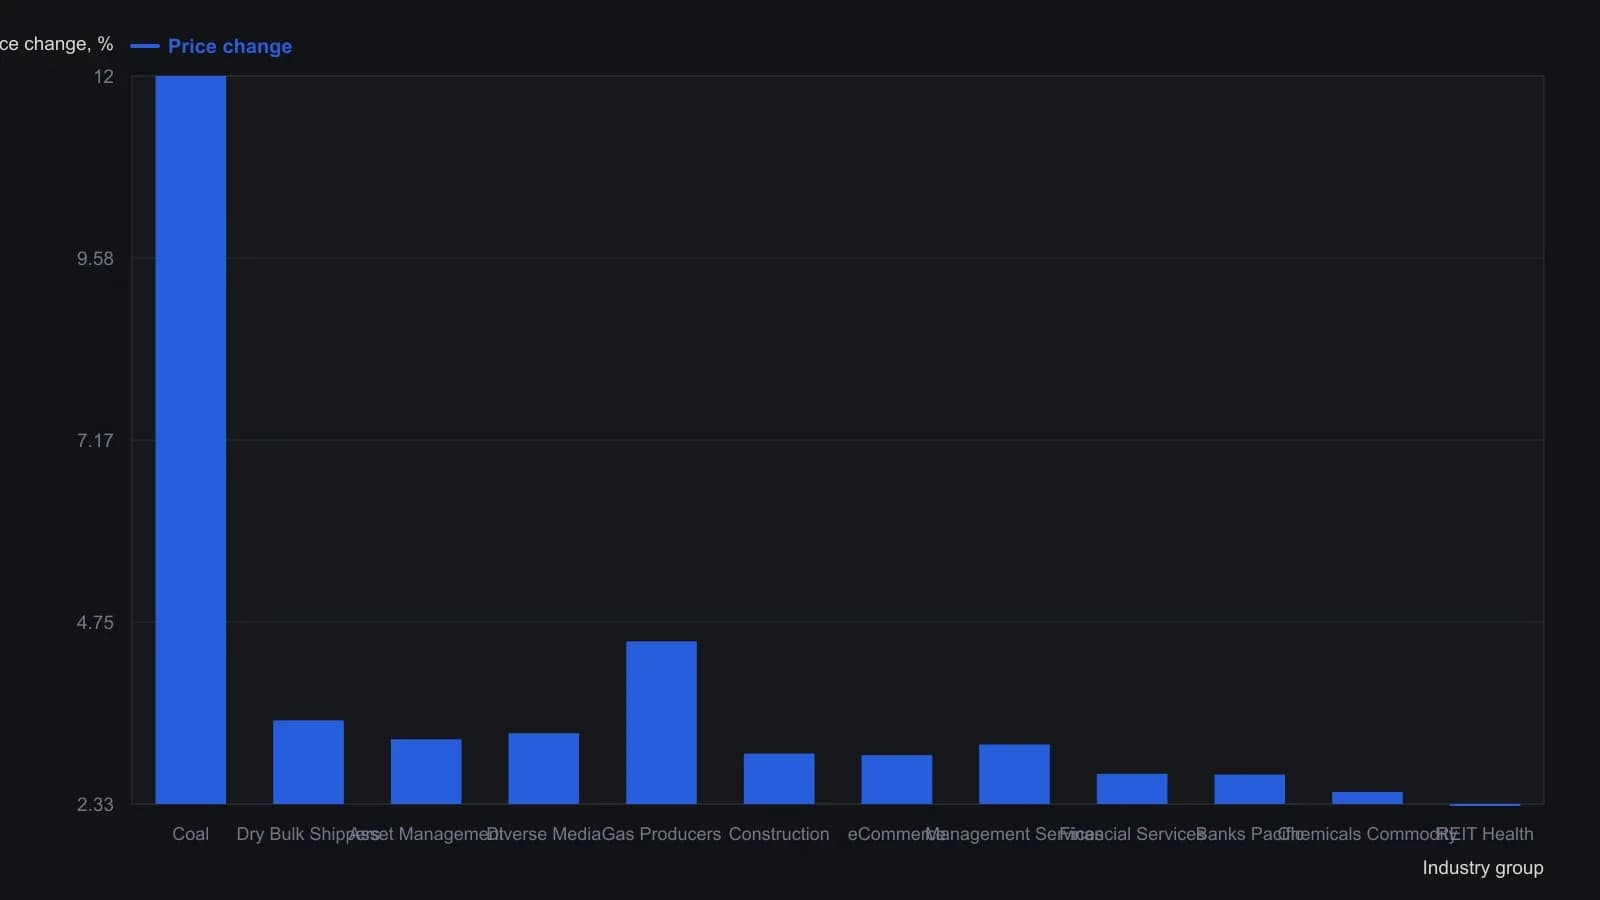
The source listed groups newly in the first quartile and sorted them by short-term rank change, not by price change. Gas Producers ranks fifth on that sort but second on price change.
Power shifts and later pivots
Power-shift and pivot logic treats an industry group as able to become overbought or oversold. The group may then strengthen after an oversold state or weaken after an overbought state. A power shift is that change in group strength, seen as movement in the opposite direction.
After an overbought or oversold move, group prices may revert. Those reversion points are labeled pivots. An out-of-sample check applies the historically specified ranking or envelope rule to later observations to see whether the baseline still describes the path.
Editorial interpretation: the later pivot is the check on the envelope. It is not a live trading cue.
Daily summary and on-screen help
A daily summary can cover six weeks of history. It can compile group trends, new highs and lows, short-term momentum rankings, and strongest and weakest money-flow groups. Screen headers can include context-sensitive help that opens an explanation of the selected item, alongside a support section written like a user manual.
All readings on this track · 45 readings
- 1992Constructing volatility-scaled bands with relative strength index confirmation
- 1994Implied volatility as a band-defined regime filter for index options
- 1995Constructing projection bands from least-squares slopes
- 1995Constructing regression projection bands and range oscillators
- 1996Constructing Bollinger bands, percent-b, and stochastics
- 1996Constructing mechanical rules from Bollinger Bands and stochastics
- 1996Constructing a standard-error envelope around a linear regression
- 1996Dual-horizon ratio envelopes and regression error channels
- 1997Rational group structure with a trend screen, RSI, and bands
- 1997Asymmetric volatility band construction
- 1998Constructing three-state filters from Bollinger band envelopes
- 1999Combination filters with Bollinger Bands and the relative strength index
- 1999Constructing stochastic timed exits and band-RSI reversals
- 1999Evaluating Bollinger Bands against fixed-width and range-based envelopes
- 2000Constructing a Bollinger Band target as a forward price
- 2001Numeric candlestick encoding with local size bands
- 2001Ranked candlestick sentiment to band-cross entries
- 2002Combining Bollinger Bands, RSI, and a stop-loss
- 2002Bollinger Bands remain filters, not forecasts
- 2002Constructing a stochastic RSI with Bollinger bands
- 2002Constructing a StochRSI and Bollinger mechanical system
- 2003Constructing volatility-scaled Bollinger envelopes
- 2003Why tick breadth fails as a market personality
- 2005Constructing Bollinger bands versus fixed trading bands
- 2006Squared versus absolute deviation in envelope construction
- 2006Confirming yen crossovers with implied volatility and bands
- 2006A daily candle reversal is a hypothesis until shorter sessions fail at the same zone
- 2008Rebuild the Relative Strength Index as price-scale bands
- 2008Reading Relative Strength Index extremes on one price axis with Bollinger Bands and moving averages
- 2011Three-filter confirmation for short-swing futures
- 2011Constructing an inverse Fisher stochastic with bands and averages
- 2012Constructing a Bollinger Band indicator suite
- 2012Stacking price extremes, crossovers, bands, and MACD
- 2012Adaptive Bollinger band impulse, trend, and momentum filters
- 2013Rescaling stochastic, percent-B, and wave-count parameters
- 2014Industry-group quartile pivots as a Bollinger Bands case study
- 2014Bollinger Bands as adaptive price envelopes: a 2014 classroom case
- 2016Trend-channel entry rules from stacked moving averages
- 2016A permission stack for Bollinger, RSI, and the 50-period average
- 2017Constructing weighted Bollinger bands and volume averages
- 2017Four swing-entry rules that share a timed exit
- 2017Two-wave monthly cycles as a regime filter
- 2019Constructing exponential-deviation-bands from a midline-average
- 2020Critiquing exponential variants of Bollinger Bands
- 2020Constructing selectable volatility and moving-average bands