2013issue C128-9
Rescaling stochastic, percent-B, and wave-count parameters
A historical reply treats a stochastic lookback, a Bollinger percent-B window, and a 1-2-3 reversal threshold as scale parameters. Those knobs are restated when the bar interval or the smallest countable wave changes.
- A published stochastic lookback, a Bollinger percent-B window, and a 1-2-3 reversal threshold are treated as scale parameters, not as portable defaults.
- Oscillator inputs of 18, 3, 30, and 3 are not treated as transferable across 60-minute, 240-minute, daily, and weekly charts; they are adapted to the minimum reversal that should count as a wave.
- A 1-2-3 wave count is one module of a multi-rule swing method and needs adapted settings when the instrument or sampling interval changes, including range bars and intervals below the daily bar.
- When the wave count is used without the remaining swing rules, the reply recommends historical tests of the chosen settings before relying on the count.
Settings that follow the bar scale
The archive treats a published stochastic lookback, a Bollinger percent-B window, and an Elliott-style 1-2-3 reversal threshold as settings that belong to a chosen scale. A stochastic oscillator is a range-position oscillator whose period and slowing inputs locate the close inside a lookback high-low window. Bollinger Bands are a volatility envelope whose percent-B reading places price inside the band; a deviation period and a short average of percent-B are the two band-side inputs discussed here. An Elliott wave 1-2-3 swing label marks impulse, retracement, and continuation legs on the chosen bar scale and is treated as one module inside a larger swing-rule set.
Oscillator inputs and the reversal threshold
A reader applied a smoothed oscillator that combined Bollinger percent-B and a stochastic oscillator with four inputs set to 18, 3, 30, and 3. Those oscillator settings are not treated as transferable across 60-minute, 240-minute, daily, and weekly charts. The reply says to adapt them to the minimum reversal that should count as a wave.
That reversal threshold is the smallest percentage or average-true-range-scaled move that should register as a countable wave on the selected sampling interval. Example adapted reversal settings that mix a percentage with an average-true-range influence were given as 0.8, 5, 1.2 on 240-minute bars, 1.5, 5, 1.5 on daily bars, and 3.8, 5, 4.5 on weekly bars.
Reversal parameters restated by bar interval
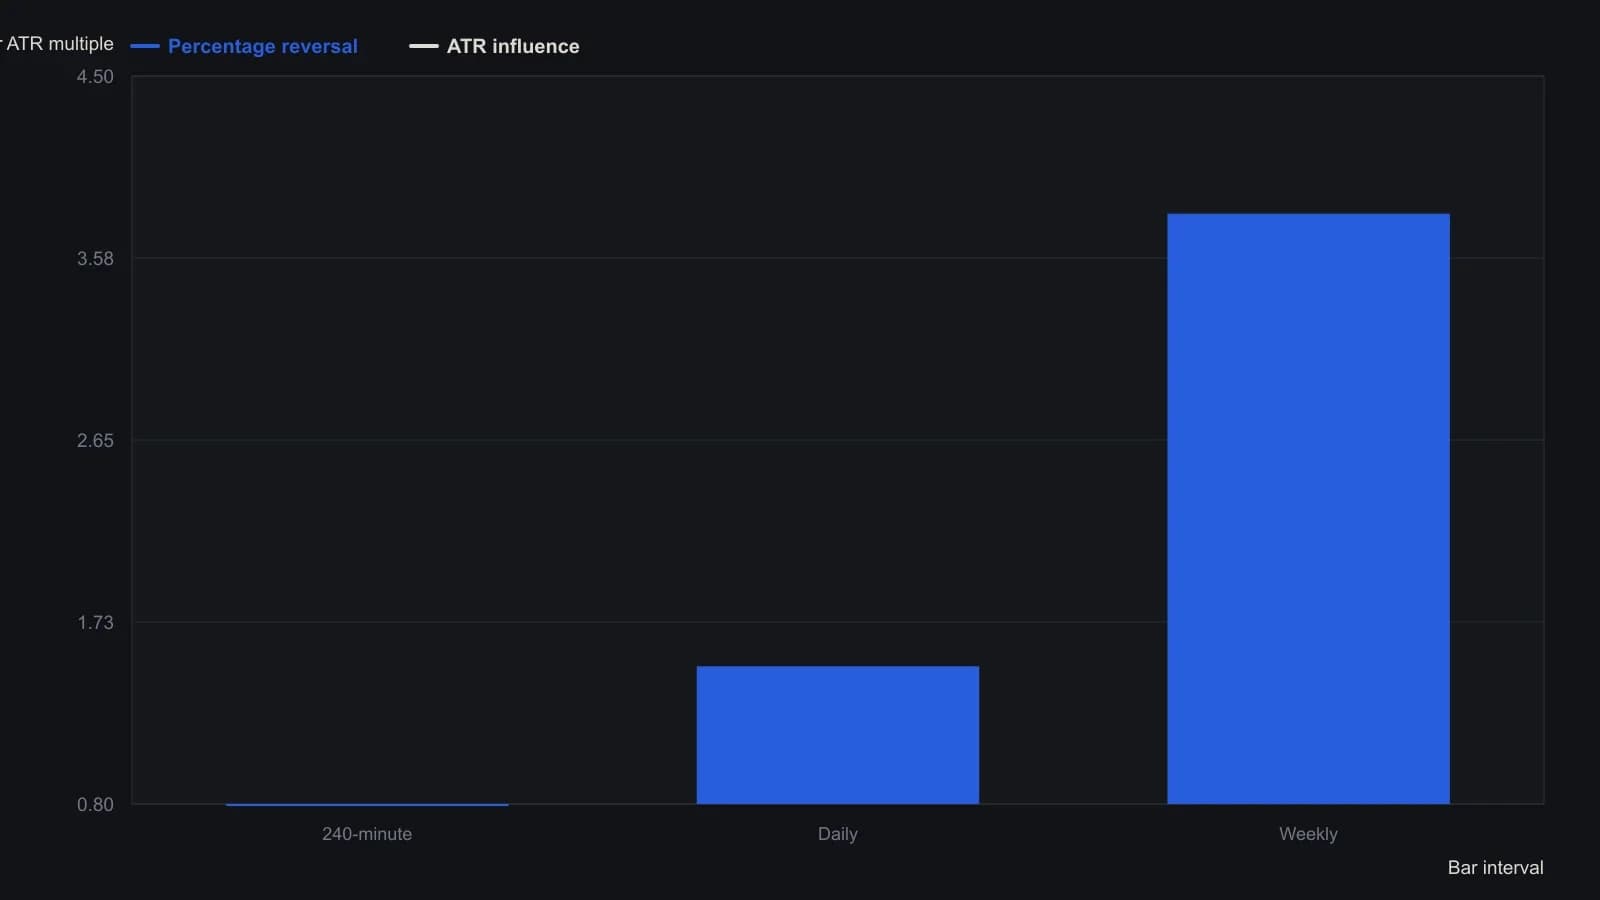
Each published triple is a percentage, a middle setting of 5 on every interval, and an ATR influence. The constant 5 is omitted. The figures are general guidance, not a fitted study on one symbol.
A wave count as one module
A 1-2-3 wave count is described as needing adapted settings once the instrument or sampling interval changes, including intervals below the daily bar and non-time constructions such as range bars. The same 1-2-3 wave count is presented as one module of a multi-rule swing method rather than a complete standalone model.
When a wave count is used without the remaining swing rules, the reply recommends historical tests of the chosen settings before relying on the count.
What updates, and what stops remaining useful
A self-adjusting relative-strength construction treats the overbought and oversold levels as the inputs that update, rather than requiring the user to retune length or a K coefficient. Those self-adjusting thresholds are overbought and oversold levels that update from formulas instead of remaining fixed constants the user must retune by hand.
A reader described placing multiple published strategies on the same symbol and 20-minute interval and then reoptimizing buy and sell lines after previously chosen inputs stopped remaining useful within a few days.
All readings on this track · 45 readings
- 1992Constructing volatility-scaled bands with relative strength index confirmation
- 1994Implied volatility as a band-defined regime filter for index options
- 1995Constructing projection bands from least-squares slopes
- 1995Constructing regression projection bands and range oscillators
- 1996Constructing Bollinger bands, percent-b, and stochastics
- 1996Constructing mechanical rules from Bollinger Bands and stochastics
- 1996Constructing a standard-error envelope around a linear regression
- 1996Dual-horizon ratio envelopes and regression error channels
- 1997Rational group structure with a trend screen, RSI, and bands
- 1997Asymmetric volatility band construction
- 1998Constructing three-state filters from Bollinger band envelopes
- 1999Combination filters with Bollinger Bands and the relative strength index
- 1999Constructing stochastic timed exits and band-RSI reversals
- 1999Evaluating Bollinger Bands against fixed-width and range-based envelopes
- 2000Constructing a Bollinger Band target as a forward price
- 2001Numeric candlestick encoding with local size bands
- 2001Ranked candlestick sentiment to band-cross entries
- 2002Combining Bollinger Bands, RSI, and a stop-loss
- 2002Bollinger Bands remain filters, not forecasts
- 2002Constructing a stochastic RSI with Bollinger bands
- 2002Constructing a StochRSI and Bollinger mechanical system
- 2003Constructing volatility-scaled Bollinger envelopes
- 2003Why tick breadth fails as a market personality
- 2005Constructing Bollinger bands versus fixed trading bands
- 2006Squared versus absolute deviation in envelope construction
- 2006Confirming yen crossovers with implied volatility and bands
- 2006A daily candle reversal is a hypothesis until shorter sessions fail at the same zone
- 2008Rebuild the Relative Strength Index as price-scale bands
- 2008Reading Relative Strength Index extremes on one price axis with Bollinger Bands and moving averages
- 2011Three-filter confirmation for short-swing futures
- 2011Constructing an inverse Fisher stochastic with bands and averages
- 2012Constructing a Bollinger Band indicator suite
- 2012Stacking price extremes, crossovers, bands, and MACD
- 2012Adaptive Bollinger band impulse, trend, and momentum filters
- 2013Rescaling stochastic, percent-B, and wave-count parameters
- 2014Industry-group quartile pivots as a Bollinger Bands case study
- 2014Bollinger Bands as adaptive price envelopes: a 2014 classroom case
- 2016Trend-channel entry rules from stacked moving averages
- 2016A permission stack for Bollinger, RSI, and the 50-period average
- 2017Constructing weighted Bollinger bands and volume averages
- 2017Four swing-entry rules that share a timed exit
- 2017Two-wave monthly cycles as a regime filter
- 2019Constructing exponential-deviation-bands from a midline-average
- 2020Critiquing exponential variants of Bollinger Bands
- 2020Constructing selectable volatility and moving-average bands