2012issue C0336-43
Adaptive Bollinger band impulse, trend, and momentum filters
Percent-b and BandWidth turn one volatility envelope into complementary impulse, trend, and momentum filters, so the same price series can show whether a move is expanding, whether envelopes are aligned, and whether later advances are fading.
- Percent-b places price at 1 on the upper band, 0 on the lower band, and 0.5 on the middle average, while BandWidth measures how wide the envelope is against that same middle average.
- BB Impulse is this period's percent-b minus last period's percent-b, so a modest move can print a large reading when bands are tight and a smaller reading when bands are wide.
- BB Momentum expresses a multi-period price change as a function of the bands, and BB Trend compares different-period envelopes, signed from +1 to -1, to distinguish trending from nontrending conditions.
- In a three-pushes-to-a-high sequence, BB Impulse prints steadily lower groups of positive readings, BB Trend fades near the second push, and BB Momentum makes lower highs, with the third-push reading clearly below the first or second.
One envelope, three complementary filters
Bollinger bands are a volatility envelope around a moving average that scales other indicators so readings adapt to how wide or tight the market is. The archive workflow starts from that single envelope and converts the same ordered price series into percent-b, BandWidth, and a family of band-relative filters.
Those filters are complementary rather than redundant. BB Impulse is a one-period snapshot of how hard price is pushing toward a band. BB Momentum stretches the same idea across a multi-period window. BB Trend asks whether envelopes of different lookbacks are aligned in a trending or a nontrending way.
Percent-b and BandWidth
Percent-b is a normalized reading of where price sits between the lower and upper bands. It places price at 1 on the upper band, 0 on the lower band, and 0.5 on the middle average.
BandWidth measures how wide the envelope is by using the middle average as the reference, so the same chart shows how expanded or compressed the envelope is. Together they give later filters a scale that already knows whether the market is tight or wide.
BB Impulse as a one-period snapshot
BB Impulse is defined as this period's percent-b minus last period's percent-b. Because the subtraction is applied to a band-relative reading, the filter captures both price change and changing band width.
Because BB Impulse is band-relative, a modest move can print a large reading when bands are tight and a smaller reading when bands are wide. The reading is an adaptive snapshot of whether price is pushing harder toward one band or the other after the envelope itself has been allowed to expand or contract.
BB Momentum as a multi-period reading
BB Momentum expresses price change over a multi-period window, such as 10 periods, as a function of the bands rather than as an unscaled rate of change. The same price move therefore looks large in a tight range and small in a volatile trend.
BB Trend from aligned envelopes
BB Trend compares alignments of different-period envelopes, such as 20-period and 50-period bands, to distinguish trending from nontrending conditions.
In an intermediate uptrend the upper 20-period and 50-period bands tend to run nearly together. A strong downtrend shows similar alignment on the lower bands.
BB Trend is signed from +1 to -1, so strong readings above zero mark a positive trend and strong readings below zero mark a negative trend.
Microsoft daily closes inside Bollinger Bands, May–November 2011
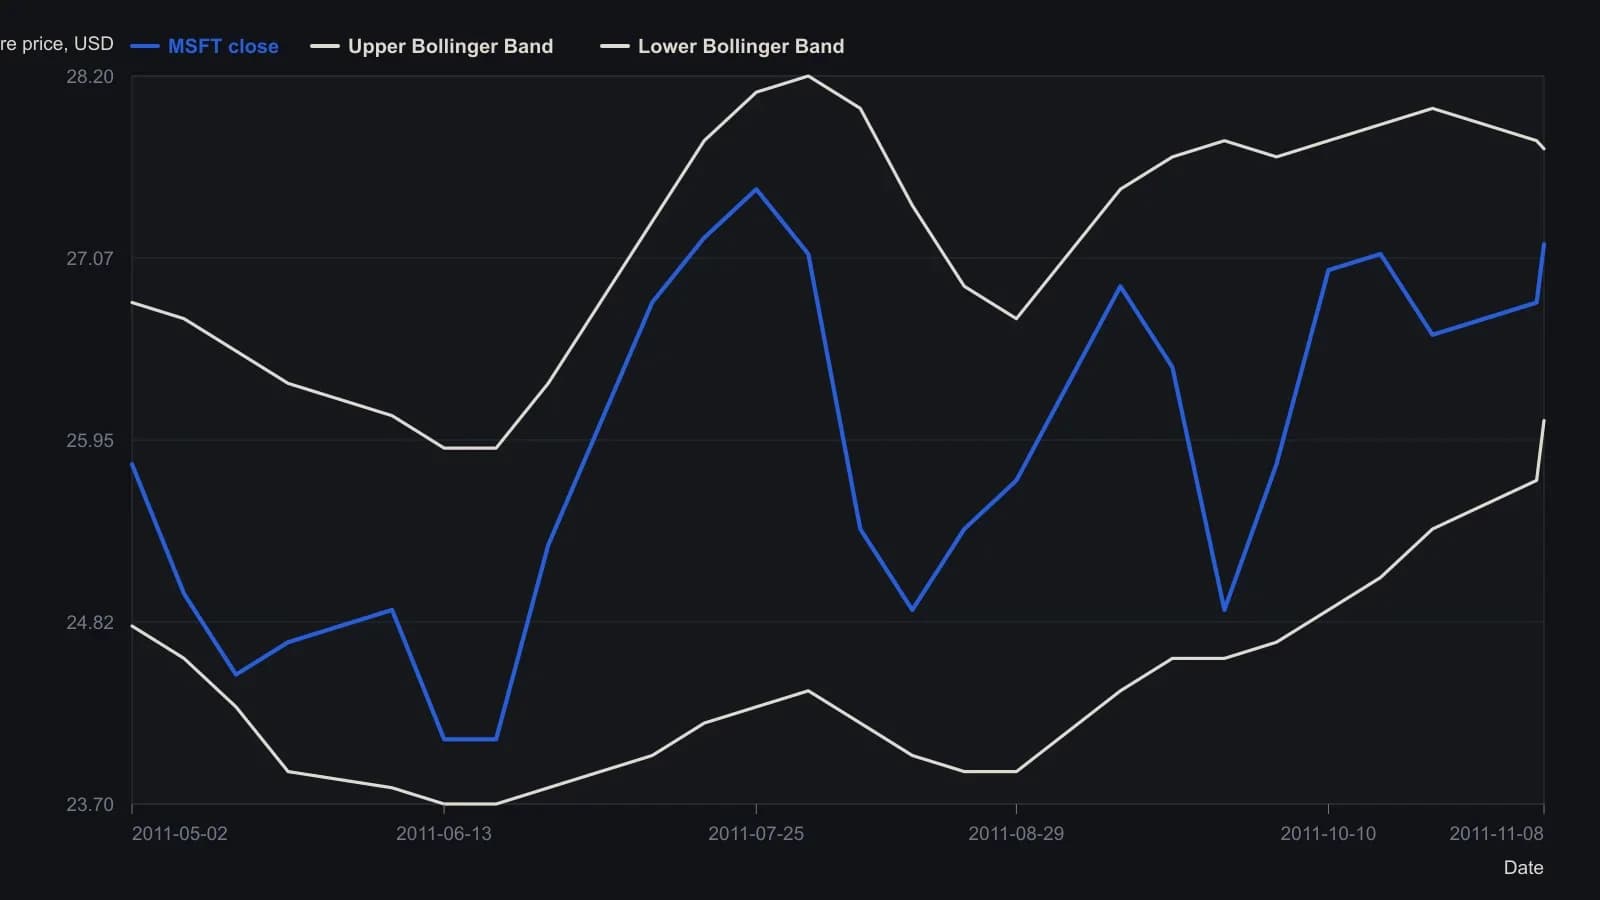
Intraday highs and lows were not sampled. Dates follow the figure’s Monday ticks; the 8 November print and its +0.36 change fix that session and the prior close. Band edges are the beige envelope, read against the right-hand dollar scale; raster resolution is about a tenth of a dollar.
Three pushes to a high
A three-pushes-to-a-high sequence is a topping pattern in which later advances lose impulse and trend strength even if price still makes a high, often with the third advance acting as a retest.
In that sequence, BB Impulse prints steadily lower groups of positive readings, BB Trend fades near the second push, and BB Momentum makes lower highs, with the third-push reading clearly below the first or second. The three filters are describing the same series from different windows: a weakening push, a fading trend alignment, and a momentum high that fails to confirm.
A smooth-valued stance
A later modeling choice replaced binary and three-state long-flat-short logic with a smooth-valued stance so partial long or short exposure can be expressed. Smooth-valued logic is a graded long-to-short stance that allows partial exposure instead of forcing a binary long-or-short decision.
All readings on this track · 45 readings
- 1992Constructing volatility-scaled bands with relative strength index confirmation
- 1994Implied volatility as a band-defined regime filter for index options
- 1995Constructing projection bands from least-squares slopes
- 1995Constructing regression projection bands and range oscillators
- 1996Constructing Bollinger bands, percent-b, and stochastics
- 1996Constructing mechanical rules from Bollinger Bands and stochastics
- 1996Constructing a standard-error envelope around a linear regression
- 1996Dual-horizon ratio envelopes and regression error channels
- 1997Rational group structure with a trend screen, RSI, and bands
- 1997Asymmetric volatility band construction
- 1998Constructing three-state filters from Bollinger band envelopes
- 1999Combination filters with Bollinger Bands and the relative strength index
- 1999Constructing stochastic timed exits and band-RSI reversals
- 1999Evaluating Bollinger Bands against fixed-width and range-based envelopes
- 2000Constructing a Bollinger Band target as a forward price
- 2001Numeric candlestick encoding with local size bands
- 2001Ranked candlestick sentiment to band-cross entries
- 2002Combining Bollinger Bands, RSI, and a stop-loss
- 2002Bollinger Bands remain filters, not forecasts
- 2002Constructing a stochastic RSI with Bollinger bands
- 2002Constructing a StochRSI and Bollinger mechanical system
- 2003Constructing volatility-scaled Bollinger envelopes
- 2003Why tick breadth fails as a market personality
- 2005Constructing Bollinger bands versus fixed trading bands
- 2006Squared versus absolute deviation in envelope construction
- 2006Confirming yen crossovers with implied volatility and bands
- 2006A daily candle reversal is a hypothesis until shorter sessions fail at the same zone
- 2008Rebuild the Relative Strength Index as price-scale bands
- 2008Reading Relative Strength Index extremes on one price axis with Bollinger Bands and moving averages
- 2011Three-filter confirmation for short-swing futures
- 2011Constructing an inverse Fisher stochastic with bands and averages
- 2012Constructing a Bollinger Band indicator suite
- 2012Stacking price extremes, crossovers, bands, and MACD
- 2012Adaptive Bollinger band impulse, trend, and momentum filters
- 2013Rescaling stochastic, percent-B, and wave-count parameters
- 2014Industry-group quartile pivots as a Bollinger Bands case study
- 2014Bollinger Bands as adaptive price envelopes: a 2014 classroom case
- 2016Trend-channel entry rules from stacked moving averages
- 2016A permission stack for Bollinger, RSI, and the 50-period average
- 2017Constructing weighted Bollinger bands and volume averages
- 2017Four swing-entry rules that share a timed exit
- 2017Two-wave monthly cycles as a regime filter
- 2019Constructing exponential-deviation-bands from a midline-average
- 2020Critiquing exponential variants of Bollinger Bands
- 2020Constructing selectable volatility and moving-average bands