2005issue C121-2
Constructing Bollinger bands versus fixed trading bands
A trading-band can mark price as relatively high or low only after you choose the offset rule. A fixed-percentage-offset keeps a constant gap from a moving average, while a standard-deviation-offset lets a bollinger-band change width with volatility without turning the outer lines into entry or exit rules.
- A trading-band is a two-line envelope placed a predefined distance from a chosen moving average so the lines mark the upper and lower bounds of a price move.
- Ordinary trading bands use a fixed-percentage-offset. A bollinger-band uses a standard-deviation-offset, so the envelope width adjusts with volatility instead of staying at a constant gap.
- The bands are a relative high-low reading meant to be paired with another analytical tool, not standalone buy or sell signals.
- Price touching an outer band is not treated as an entry or exit by itself. The envelope stays a high-low reference even if the moving-average length or the number of deviations is changed.
How a moving-average envelope is built
Trading bands, sometimes called envelopes, are constructed by placing two lines a predefined distance from a chosen moving average so they mark the upper and lower bounds of a price move. That two-line envelope is a trading-band: the lines act as visual high and low boundaries around price.
Those bands are framed as a relative reading of whether price is high or low, not as standalone buy or sell signals, and are meant to be paired with another analytical tool.
Editorial: a moving-average envelope answers whether price is relatively high or low only after you choose the offset rule that places the outer lines.
Fixed percentage versus standard-deviation offsets
Ordinary trading bands sit a predetermined fixed percentage above and below the moving average. That constant gap is a fixed-percentage-offset, independent of changing volatility.
Bollinger lines sit at standard-deviation distances from a moving average. That placement is a standard-deviation-offset: each outer line sits a stated multiple of recent price dispersion above or below the middle average.
Because standard deviation is a volatility measure, the Bollinger construction adjusts its own width instead of remaining at a constant offset. The three-line envelope is a bollinger-band whose outer lines expand and contract with volatility.
What the three lines describe
A common default uses a 20-period simple moving average as the middle line, with the outer lines two 20-period standard deviations above and below that average, usually from daily closes. That central line is the middle-band, the trend reference from which the outer lines are measured.
In that three-line layout the outer bands describe high and low volatility while the middle band describes the trend.
S&P 500 daily with 20-period Bollinger Bands
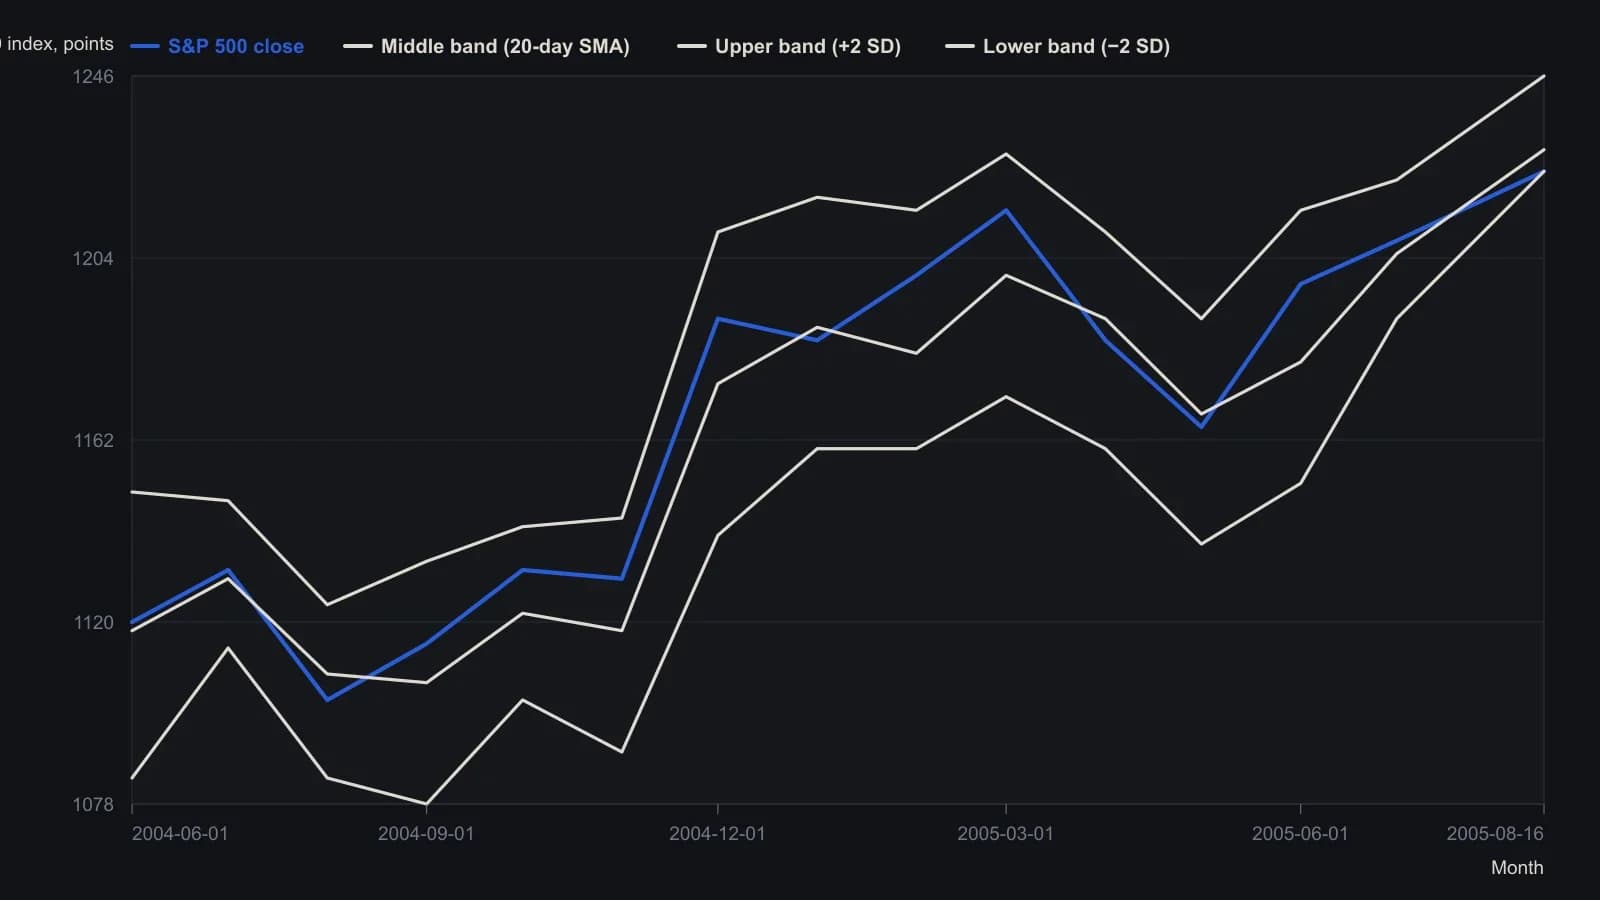
Source plot is daily OHLC with a 20-period simple moving average plus or minus two 20-period standard deviations, usually on closes. Digitized at roughly monthly marks because the raster does not support bar-by-bar precision.
Touches are not entry or exit rules
Price touching an outer band is not treated as an entry or exit by itself. A move that begins at one band often continues toward the opposite band, and closes outside the envelope are more often read as continuation than reversal.
The moving-average length and the number of deviations can be changed, but the envelope remains a high-low reference and is not intended as the sole reason to enter or exit.
All readings on this track · 45 readings
- 1992Constructing volatility-scaled bands with relative strength index confirmation
- 1994Implied volatility as a band-defined regime filter for index options
- 1995Constructing projection bands from least-squares slopes
- 1995Constructing regression projection bands and range oscillators
- 1996Constructing Bollinger bands, percent-b, and stochastics
- 1996Constructing mechanical rules from Bollinger Bands and stochastics
- 1996Constructing a standard-error envelope around a linear regression
- 1996Dual-horizon ratio envelopes and regression error channels
- 1997Rational group structure with a trend screen, RSI, and bands
- 1997Asymmetric volatility band construction
- 1998Constructing three-state filters from Bollinger band envelopes
- 1999Combination filters with Bollinger Bands and the relative strength index
- 1999Constructing stochastic timed exits and band-RSI reversals
- 1999Evaluating Bollinger Bands against fixed-width and range-based envelopes
- 2000Constructing a Bollinger Band target as a forward price
- 2001Numeric candlestick encoding with local size bands
- 2001Ranked candlestick sentiment to band-cross entries
- 2002Combining Bollinger Bands, RSI, and a stop-loss
- 2002Bollinger Bands remain filters, not forecasts
- 2002Constructing a stochastic RSI with Bollinger bands
- 2002Constructing a StochRSI and Bollinger mechanical system
- 2003Constructing volatility-scaled Bollinger envelopes
- 2003Why tick breadth fails as a market personality
- 2005Constructing Bollinger bands versus fixed trading bands
- 2006Squared versus absolute deviation in envelope construction
- 2006Confirming yen crossovers with implied volatility and bands
- 2006A daily candle reversal is a hypothesis until shorter sessions fail at the same zone
- 2008Rebuild the Relative Strength Index as price-scale bands
- 2008Reading Relative Strength Index extremes on one price axis with Bollinger Bands and moving averages
- 2011Three-filter confirmation for short-swing futures
- 2011Constructing an inverse Fisher stochastic with bands and averages
- 2012Constructing a Bollinger Band indicator suite
- 2012Stacking price extremes, crossovers, bands, and MACD
- 2012Adaptive Bollinger band impulse, trend, and momentum filters
- 2013Rescaling stochastic, percent-B, and wave-count parameters
- 2014Industry-group quartile pivots as a Bollinger Bands case study
- 2014Bollinger Bands as adaptive price envelopes: a 2014 classroom case
- 2016Trend-channel entry rules from stacked moving averages
- 2016A permission stack for Bollinger, RSI, and the 50-period average
- 2017Constructing weighted Bollinger bands and volume averages
- 2017Four swing-entry rules that share a timed exit
- 2017Two-wave monthly cycles as a regime filter
- 2019Constructing exponential-deviation-bands from a midline-average
- 2020Critiquing exponential variants of Bollinger Bands
- 2020Constructing selectable volatility and moving-average bands