2001issue C031-7
Numeric candlestick encoding with local size bands
The archive workflow replaces a named candle shape with a three-part local-size score. Each bar is split into a body, an upper shadow, and a lower shadow, then labeled with local size-thresholds so the parts can be added, averaged, and written as a testable rule.
- Each bar is split into a body, an upper shadow, and a lower shadow computed from open, high, low, and close.
- Separate size-thresholds on those three series label each part small, medium, or large.
- Direction and the three size labels add into one candle-score, which a moving average can smooth into a continuous series.
- The same scoring procedure is shown on daily and intraday charts, with signed and weighted revisions.
Replace a named shape with three measured parts
Each bar is split into a body, an upper shadow, and a lower shadow computed from open, high, low, and close. The body is the absolute distance between open and close. The upper shadow is the distance from the top of the body to the high. The lower shadow is the distance from the bottom of the body to the low.
The archive is not keeping the bar under a pattern name. It is turning the same open, high, low, and close structure into three parts that can be scored.
Band each series with local size-thresholds
Separate band thresholds are built on the body series, the upper-shadow series, and the lower-shadow series. Each size-threshold is the band boundary that separates small, medium, and large parts of a candle. Those bands are local high and low size thresholds built from a lookback window and a deviation multiple.
A default construction uses a 55-observation lookback and a 0.5 deviation multiple, and both values are left as adjustable inputs. Body and shadow sizes are labeled small, medium, or large according to whether they sit below the lower band, between the bands, or above the upper band.
Add the parts into one candle-score
Direction and the three size labels are added together into one integer score per bar. That candle-score is the single integer formed by adding a direction term to body-size and shadow-size terms.
A weighted revision scales the body, upper-shadow, and lower-shadow pieces by separate coefficients before they are added.
Intel candle-strength index, spring 2000
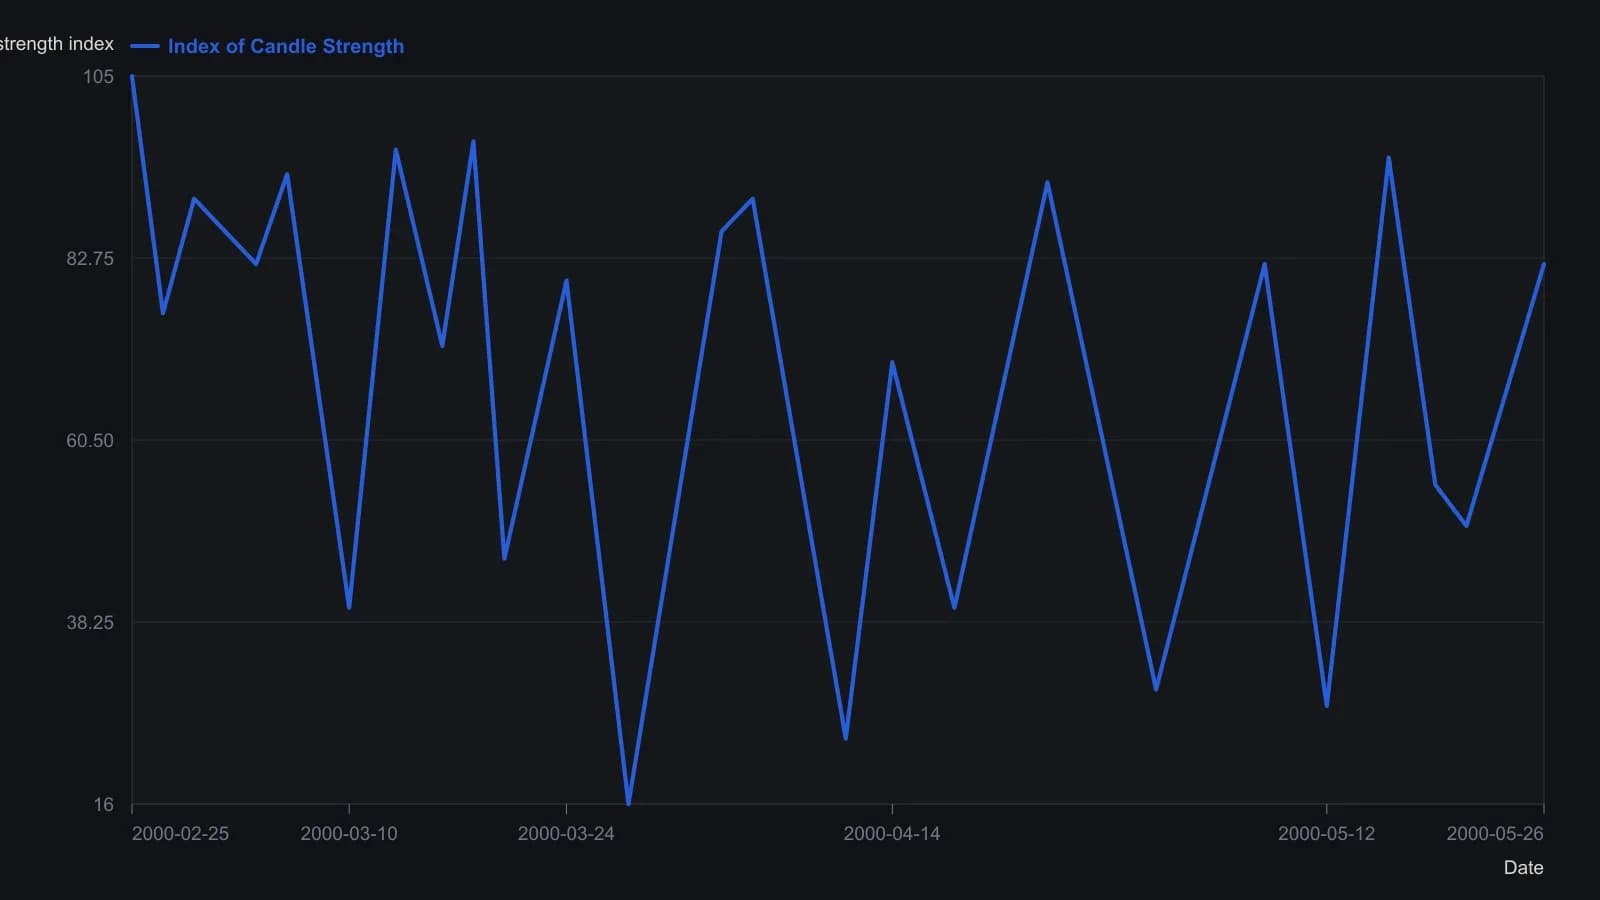
Y values are approximate to the nearest few index points on a 10–130 scale. The pane is labeled Index of Candle Strength with arguments High, Low, Open, Close, 2. Dates follow the printed weekly grid; a few turning points between grid lines were added so the swings stay faithful to the curve.
Average the score for comparison and crossings
A moving average is applied to the per-bar candle-score so one-bar codes become a continuous series for comparison and crossings. One indicator construction plots that score beside a 9-bar average of the same score. Another construction applies a moving average three times in succession to the score to form a smoother strength series.
A signed variant averages the score over 20 bars and treats a drop through -25 and a rise through 25 as opposite extreme readings.
Keep the same scoring on more than one chart scale
The same scoring procedure is shown on both daily and intraday charts.
Editorial interpretation: chart scale remains part of the input. The archive shows one scoring procedure on more than one scale rather than a separate construction for each.
All readings on this track · 45 readings
- 1992Constructing volatility-scaled bands with relative strength index confirmation
- 1994Implied volatility as a band-defined regime filter for index options
- 1995Constructing projection bands from least-squares slopes
- 1995Constructing regression projection bands and range oscillators
- 1996Constructing Bollinger bands, percent-b, and stochastics
- 1996Constructing mechanical rules from Bollinger Bands and stochastics
- 1996Constructing a standard-error envelope around a linear regression
- 1996Dual-horizon ratio envelopes and regression error channels
- 1997Rational group structure with a trend screen, RSI, and bands
- 1997Asymmetric volatility band construction
- 1998Constructing three-state filters from Bollinger band envelopes
- 1999Combination filters with Bollinger Bands and the relative strength index
- 1999Constructing stochastic timed exits and band-RSI reversals
- 1999Evaluating Bollinger Bands against fixed-width and range-based envelopes
- 2000Constructing a Bollinger Band target as a forward price
- 2001Numeric candlestick encoding with local size bands
- 2001Ranked candlestick sentiment to band-cross entries
- 2002Combining Bollinger Bands, RSI, and a stop-loss
- 2002Bollinger Bands remain filters, not forecasts
- 2002Constructing a stochastic RSI with Bollinger bands
- 2002Constructing a StochRSI and Bollinger mechanical system
- 2003Constructing volatility-scaled Bollinger envelopes
- 2003Why tick breadth fails as a market personality
- 2005Constructing Bollinger bands versus fixed trading bands
- 2006Squared versus absolute deviation in envelope construction
- 2006Confirming yen crossovers with implied volatility and bands
- 2006A daily candle reversal is a hypothesis until shorter sessions fail at the same zone
- 2008Rebuild the Relative Strength Index as price-scale bands
- 2008Reading Relative Strength Index extremes on one price axis with Bollinger Bands and moving averages
- 2011Three-filter confirmation for short-swing futures
- 2011Constructing an inverse Fisher stochastic with bands and averages
- 2012Constructing a Bollinger Band indicator suite
- 2012Stacking price extremes, crossovers, bands, and MACD
- 2012Adaptive Bollinger band impulse, trend, and momentum filters
- 2013Rescaling stochastic, percent-B, and wave-count parameters
- 2014Industry-group quartile pivots as a Bollinger Bands case study
- 2014Bollinger Bands as adaptive price envelopes: a 2014 classroom case
- 2016Trend-channel entry rules from stacked moving averages
- 2016A permission stack for Bollinger, RSI, and the 50-period average
- 2017Constructing weighted Bollinger bands and volume averages
- 2017Four swing-entry rules that share a timed exit
- 2017Two-wave monthly cycles as a regime filter
- 2019Constructing exponential-deviation-bands from a midline-average
- 2020Critiquing exponential variants of Bollinger Bands
- 2020Constructing selectable volatility and moving-average bands