1992issue C101-13
A semiconductor seasonal-index before the relative-strength overlay
A historical case used one semiconductor equity to isolate a seasonal-component, turn a seasonal-index into a month-resolution seasonal-trading-window, and only then overlay a relative-strength-index as a timing adjunct.
- The case used one semiconductor equity rather than a basket or index so a seasonal pattern could be isolated in a single name.
- A ratio-to-moving-average step leaves the seasonal-component with the irregular residual; a modified-mean is rescaled into a seasonal-index that averages 100.
- Seasonal highs and lows were treated as month-span guides for a seasonal-trading-window, not as exact-day signals.
- A 21-day relative-strength-index served only as a timing overlay, and names with strong growth were set aside because trend can overwhelm seasonality.
One semiconductor name, not a basket
The case used one semiconductor equity rather than a basket or index so a seasonal pattern could be isolated in a single name.
Seasonal analysis is applied to regularly repeating movements that last a year or less and arise from climate, economic activity, or customs.
Leave the seasonal-component in the residual
Each price is treated as the joint product of trend, cycle, seasonal, and irregular influences, so a four-quarter moving average is used to cancel trend and cycle and leave the seasonal-plus-irregular residual.
That ratio-to-moving-average step divides each observation by a centered multi-period average. Trend and longer cycles drop out, and the seasonal-component remains with the irregular residual.
Rescale like-period ratios into a seasonal-index
Twelve years of quarterly closes were used to build the quarterly seasonal-index, and the same span was used for a monthly index shown without the intermediate arithmetic.
After ratios are grouped by quarter, a modified-mean that drops the high and low values is rescaled so the four means sum to 400 and average 100.
The seasonal-index can be read as a year-round regime map with a neutral baseline of 100, not only as peak and trough dates.
A seasonal-trading-window at month resolution
The monthly seasonal-index built by the same procedure placed a seasonal high in May and a seasonal low in November.
Seasonal highs and lows were treated as month-span guides only, with chart markers placed arbitrarily inside those months so they are not read as exact-day signals. The implied seasonal-trading-window is a month-resolution interval for entry, exit, or stand-aside.
The seasonal table is framed as a year-round signpost for whether price is tracking or departing from seasonal tendency, not only as a pair of high and low dates.
Relative strength only as a timing overlay
A 21-day relative-strength-index, with readings below 30 treated as oversold and above 70 as overbought, was overlaid on daily charts from early 1989 through June 1992 as a timing adjunct to the seasonal map.
In this historical workflow the relative-strength-index is a bounded oscillator computed on a fixed lookback of ordered prices and used only as a timing overlay on the seasonal map.
When a growth trend overwhelms the calendar
Names with strong growth characteristics were set aside as weaker candidates because a dominant trend component can overwhelm cyclical and seasonal factors.
AMD first study year against the May–November window
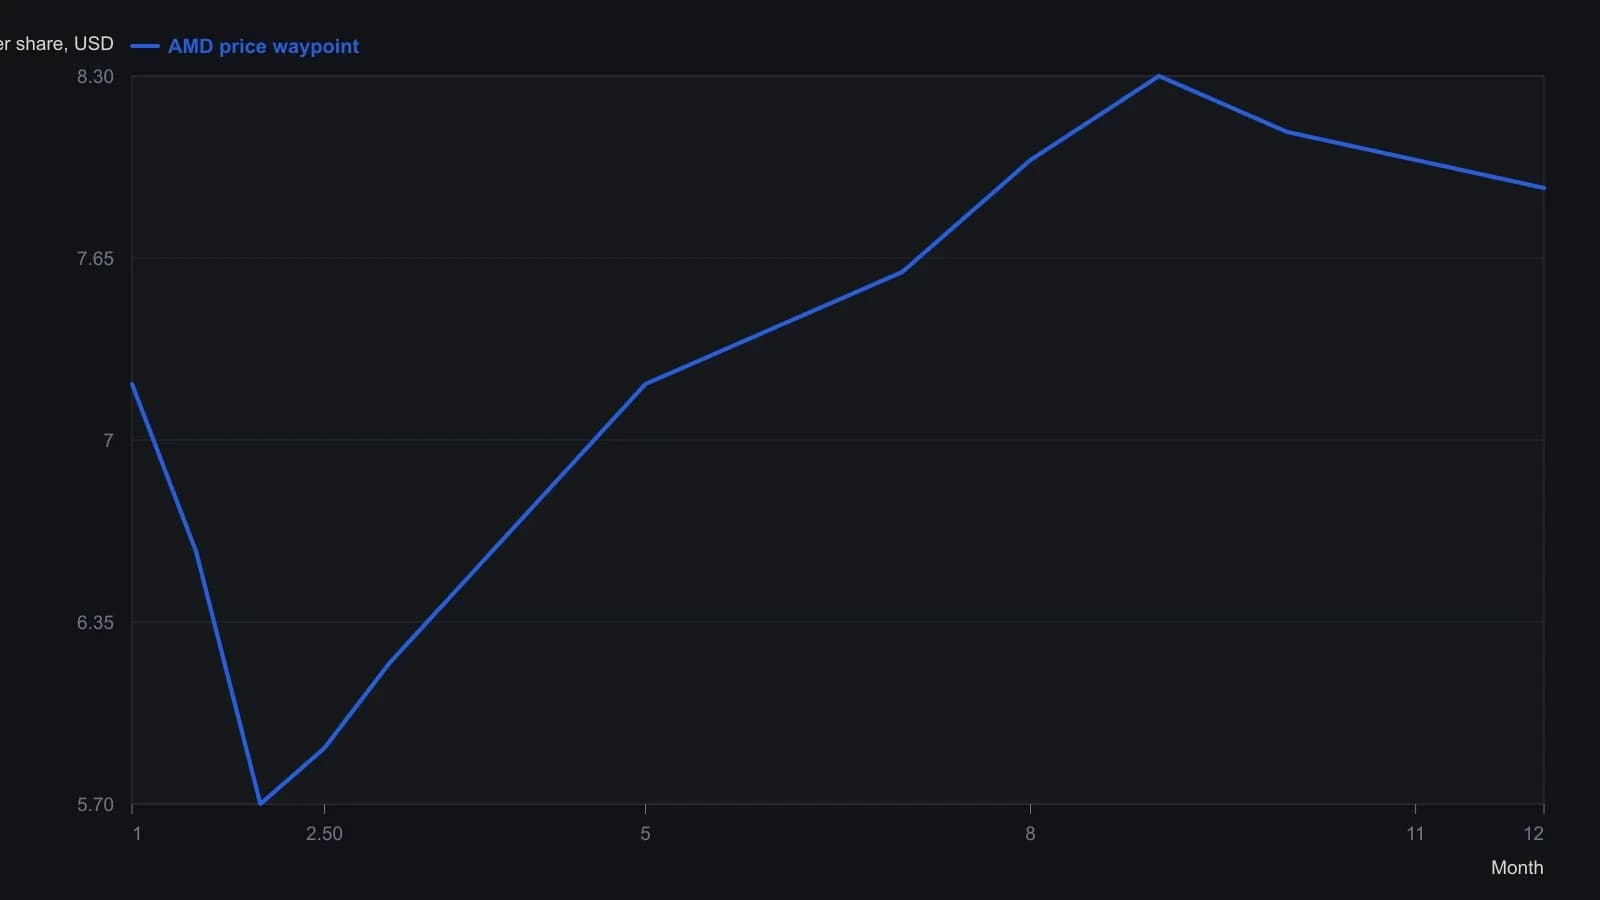
Low-resolution daily OHLC scan. Printed ticks of 50/60/70/80 are read as $5/$6/$7/$8 per share. Values are approximate monthly readings, not official session closes.
All readings on this track · 21 readings
- 1986Two gates for setup and operator readiness
- 1990Time-only cycle dates in a Treasury bond case study
- 1990Constant-dollar regimes, the value line, and nested cycles
- 1992The four-year election cycle as an equity regime map
- 1992A semiconductor seasonal-index before the relative-strength overlay
- 1992Lock the holiday window as a regime, then veto resistance
- 1995Regime-aware stock screening with intermarket context
- 1996Standard-error bands, width gates, and weekday counts
- 1999Constructing seasonal factors from centered moving averages
- 2000Seasonal window, then weekly breadth
- 2004Copper as a regime map for cycles and recessions
- 2008Election-cycle windows as a mechanical seasonal system
- 2012A 2012 case study in Kondratieff-wave and presidential-cycle overlays
- 2012The October to May window as a mechanical portfolio procedure
- 2013Half-year seasonality as an equity regime overlay
- 2014Seasonal cycles as a regime overlay
- 2015Seasonal oil window as a defined-risk spread case
- 2017Calendar regimes, RSI events, and sector rotation rules
- 2018Seasonal windows as testable entry and abstention rules
- 2019Calendar rotation of seasonal and regime questions
- 2020Constructing calendar interval votes for cycle workbooks