2001issue C091-5
Ranked candlestick sentiment to band-cross entries
Each candlestick can be stored as a CandleCode rank on a bearish-to-bullish scale. A documented smoother and a Bollinger reference band then turn that rank series into a long-short rule whose decision lines stay comparable when the rank amplitude changes.
- CandleCode attaches a numeric rank to each candlestick so strongly bearish structure scores lowest and strongly bullish structure scores highest.
- A double-smoothed CandleCode follows major sentiment swings and can mark the start of bullish and bearish reversals while hourly price is still moving sideways.
- A fixed-threshold cross uses constant upper and lower levels, but those levels sit in different parts of the range after the smoothed rank jumps in amplitude.
- A Bollinger reference band replaces the constants with a volatility-scaled envelope, and asymmetric band width lets the four-parameter band system search lower and upper deviations separately.
A rank for every candlestick
Each candlestick is mapped to a numeric CandleCode rank. The rank is lowest for strongly bearish structure and highest for strongly bullish structure.
CandleCode converts typical pattern readings into an ordered sentiment scale. The later entry and exit rules act on that rank series, not on a named list of candle shapes.
A smoother that isolates sentiment turns
The first design choice is a documented smoother. A double-smoothed CandleCode is a CandleCode series passed through a longer moving average and then a short second average or triplet filter.
On hourly British pound prices from 26 February to 15 March 2001, a 21-period simple moving average of the CandleCode, then a triple two-point moving-average filter, followed major swings. It marked a bullish turn on 26 February and bearish turns on 2 March and 7 March.
That double-smoothed series described British pound consolidation between 1.46 and 1.4750. It flagged a 13 March support-break risk after a 1 to 13 March double top, and it turned bullish ahead of the 15 March reversal.
On hourly British pound prices from 23 March to 5 April 2001, the appropriately smoothed CandleCode marked the start of both bullish and bearish reversals while price was moving sideways rather than in a long-lasting trend.
When fixed levels stop being comparable
A threshold system enters long when an exponentially double-smoothed CandleCode, first length 21 and then length 3, crosses a lower fixed level from below. It enters short when that series crosses an upper fixed level from above. The first smoothing length and both levels are left as backtest parameters.
That rule is a fixed-threshold cross: a long or a short when the smoothed rank crosses a constant lower or upper level from the outside.
On a longer hourly British pound sample that includes 14 December 2000 through 12 March 2001, the same double-smoothed CandleCode showed nonuniform volatility. Amplitude jumped in early February and late March, so fixed decision levels sat in different parts of the indicator range.
Fixed CandleCode levels fail when rank volatility jumps
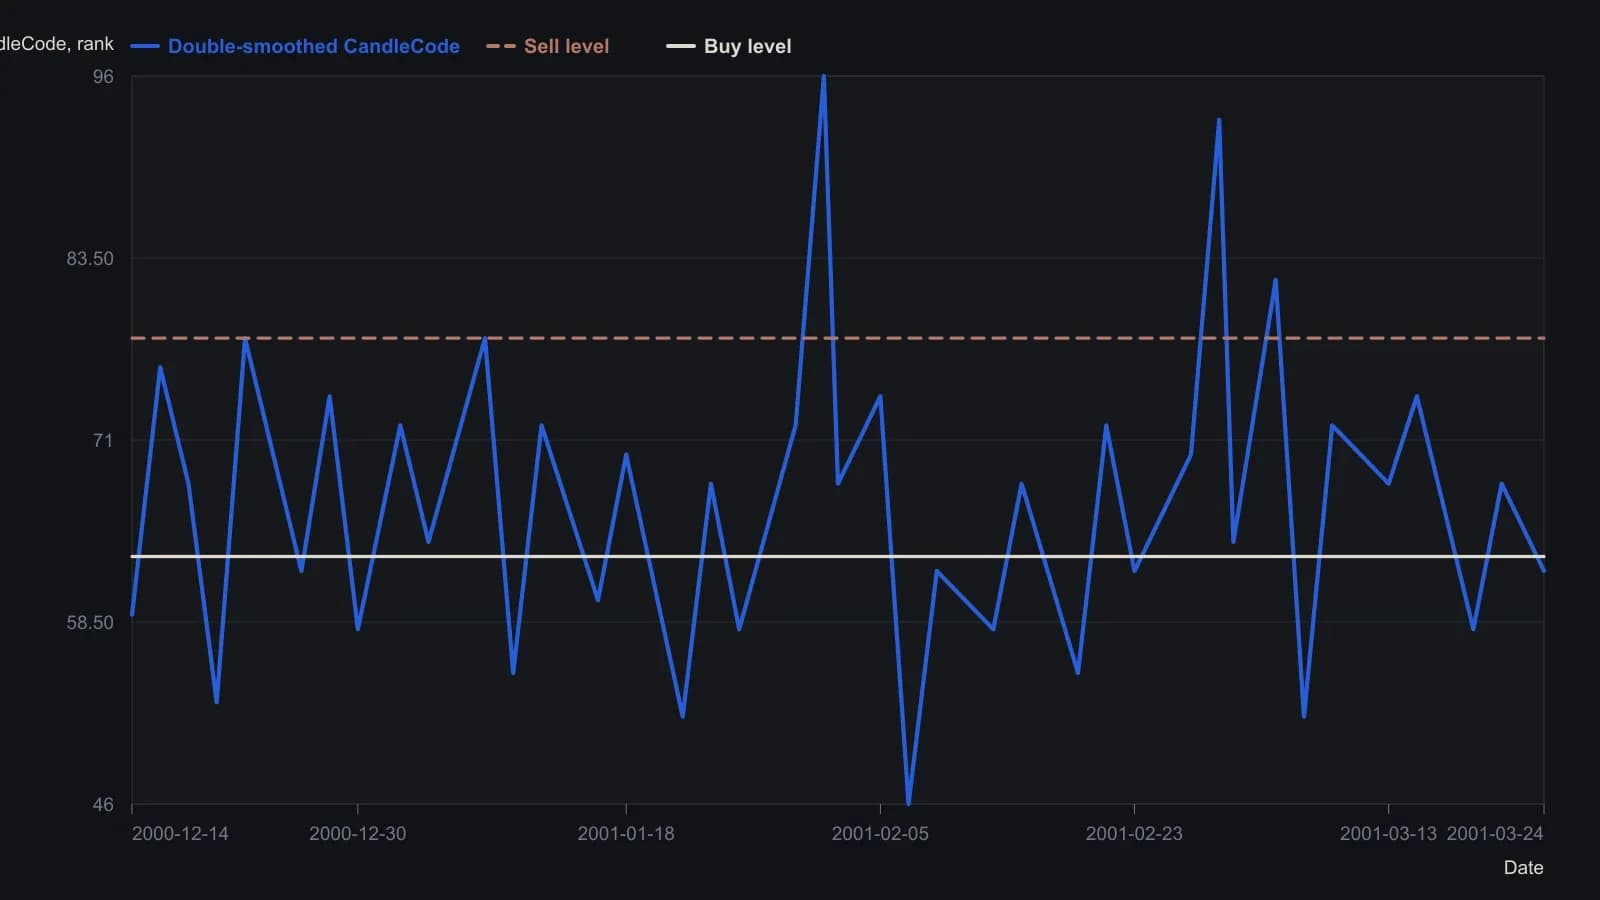
First exponential smooth length 21, second exponential smooth length 3. Thresholds are the red and green horizontals drawn on Figure 3; the source does not print those level numbers in the text.
Band crosses on the smoothed rank
Because those fixed lines do not adapt to indicator-volatility jumps, the upper decision line is replaced by a Bollinger Band top and the lower line by a Bollinger Band bottom of the smoothed CandleCode. Independent deviation factors are allowed on each side.
The moving envelope is a Bollinger reference band: a volatility-scaled envelope around the smoothed rank that supplies moving upper and lower decision lines. Separate deviation multipliers on those two lines are asymmetric band width.
One hourly British pound window from 18 to 26 January 2001 used nonsymmetric Bollinger Bands on a simple moving average of CandleCode, with a smaller lower-band deviation than the upper-band deviation. Another window from 30 January to 8 February 2001 used a symmetric band on a CandleCode smoothed by a 21-period average and then a triplet.
The band-crossing system opens long when the double-smoothed CandleCode crosses the lower band from below and opens short when it crosses the upper band from above. A search on November 2000 through February 2001 selected average length 45, band period 13, lower deviation 1.2, and upper deviation 1.5. One illustrated short on 23 March was closed by a 70-point stop.
Those searchable inputs are the four-parameter band system: CandleCode average length, band lookback, lower-band deviation, and upper-band deviation.
All readings on this track · 45 readings
- 1992Constructing volatility-scaled bands with relative strength index confirmation
- 1994Implied volatility as a band-defined regime filter for index options
- 1995Constructing projection bands from least-squares slopes
- 1995Constructing regression projection bands and range oscillators
- 1996Constructing Bollinger bands, percent-b, and stochastics
- 1996Constructing mechanical rules from Bollinger Bands and stochastics
- 1996Constructing a standard-error envelope around a linear regression
- 1996Dual-horizon ratio envelopes and regression error channels
- 1997Rational group structure with a trend screen, RSI, and bands
- 1997Asymmetric volatility band construction
- 1998Constructing three-state filters from Bollinger band envelopes
- 1999Combination filters with Bollinger Bands and the relative strength index
- 1999Constructing stochastic timed exits and band-RSI reversals
- 1999Evaluating Bollinger Bands against fixed-width and range-based envelopes
- 2000Constructing a Bollinger Band target as a forward price
- 2001Numeric candlestick encoding with local size bands
- 2001Ranked candlestick sentiment to band-cross entries
- 2002Combining Bollinger Bands, RSI, and a stop-loss
- 2002Bollinger Bands remain filters, not forecasts
- 2002Constructing a stochastic RSI with Bollinger bands
- 2002Constructing a StochRSI and Bollinger mechanical system
- 2003Constructing volatility-scaled Bollinger envelopes
- 2003Why tick breadth fails as a market personality
- 2005Constructing Bollinger bands versus fixed trading bands
- 2006Squared versus absolute deviation in envelope construction
- 2006Confirming yen crossovers with implied volatility and bands
- 2006A daily candle reversal is a hypothesis until shorter sessions fail at the same zone
- 2008Rebuild the Relative Strength Index as price-scale bands
- 2008Reading Relative Strength Index extremes on one price axis with Bollinger Bands and moving averages
- 2011Three-filter confirmation for short-swing futures
- 2011Constructing an inverse Fisher stochastic with bands and averages
- 2012Constructing a Bollinger Band indicator suite
- 2012Stacking price extremes, crossovers, bands, and MACD
- 2012Adaptive Bollinger band impulse, trend, and momentum filters
- 2013Rescaling stochastic, percent-B, and wave-count parameters
- 2014Industry-group quartile pivots as a Bollinger Bands case study
- 2014Bollinger Bands as adaptive price envelopes: a 2014 classroom case
- 2016Trend-channel entry rules from stacked moving averages
- 2016A permission stack for Bollinger, RSI, and the 50-period average
- 2017Constructing weighted Bollinger bands and volume averages
- 2017Four swing-entry rules that share a timed exit
- 2017Two-wave monthly cycles as a regime filter
- 2019Constructing exponential-deviation-bands from a midline-average
- 2020Critiquing exponential variants of Bollinger Bands
- 2020Constructing selectable volatility and moving-average bands