1994issue C051-3
Implied volatility as a band-defined regime filter for index options
The archive builds an implied-volatility-index from an oex-option-basket and places that series in a band-defined-regime so an OEX option can be judged expensive or inexpensive without a full repricing. A macd-overlay on the same series adds momentum context, and an option-overlay-screen withholds a conservative long stance when the reading already sits in the expensive zone.
- The implied-volatility-index is a weighted blend of implied values from an oex-option-basket and is used as a real-time valuation check, not as a price forecast.
- A band-defined-regime labels readings near the upper band as expensive-option conditions and readings near the lower band as inexpensive or roughly fair.
- A macd-overlay on the same volatility series adds momentum context to that band classification.
- The option-overlay-screen withholds a conservative long OEX-option stance unless the implied-volatility-index sits near the lower band.
A real-time check on option premium
The volatility index in the source is a weighted blend of implied values from eight S&P 100 options, the oex-option-basket. That implied-volatility-index is presented as a real-time valuation check so an OEX option can be judged expensive or inexpensive without repricing the contract from first principles.
The write-up treats the path of implied volatility as equally material to option outcomes as the path of the underlying price. In that framing the index is a market-wide reading of how expensive option premium is, rather than a forecast of the cash market.
Implied volatility index from the OEX option basket
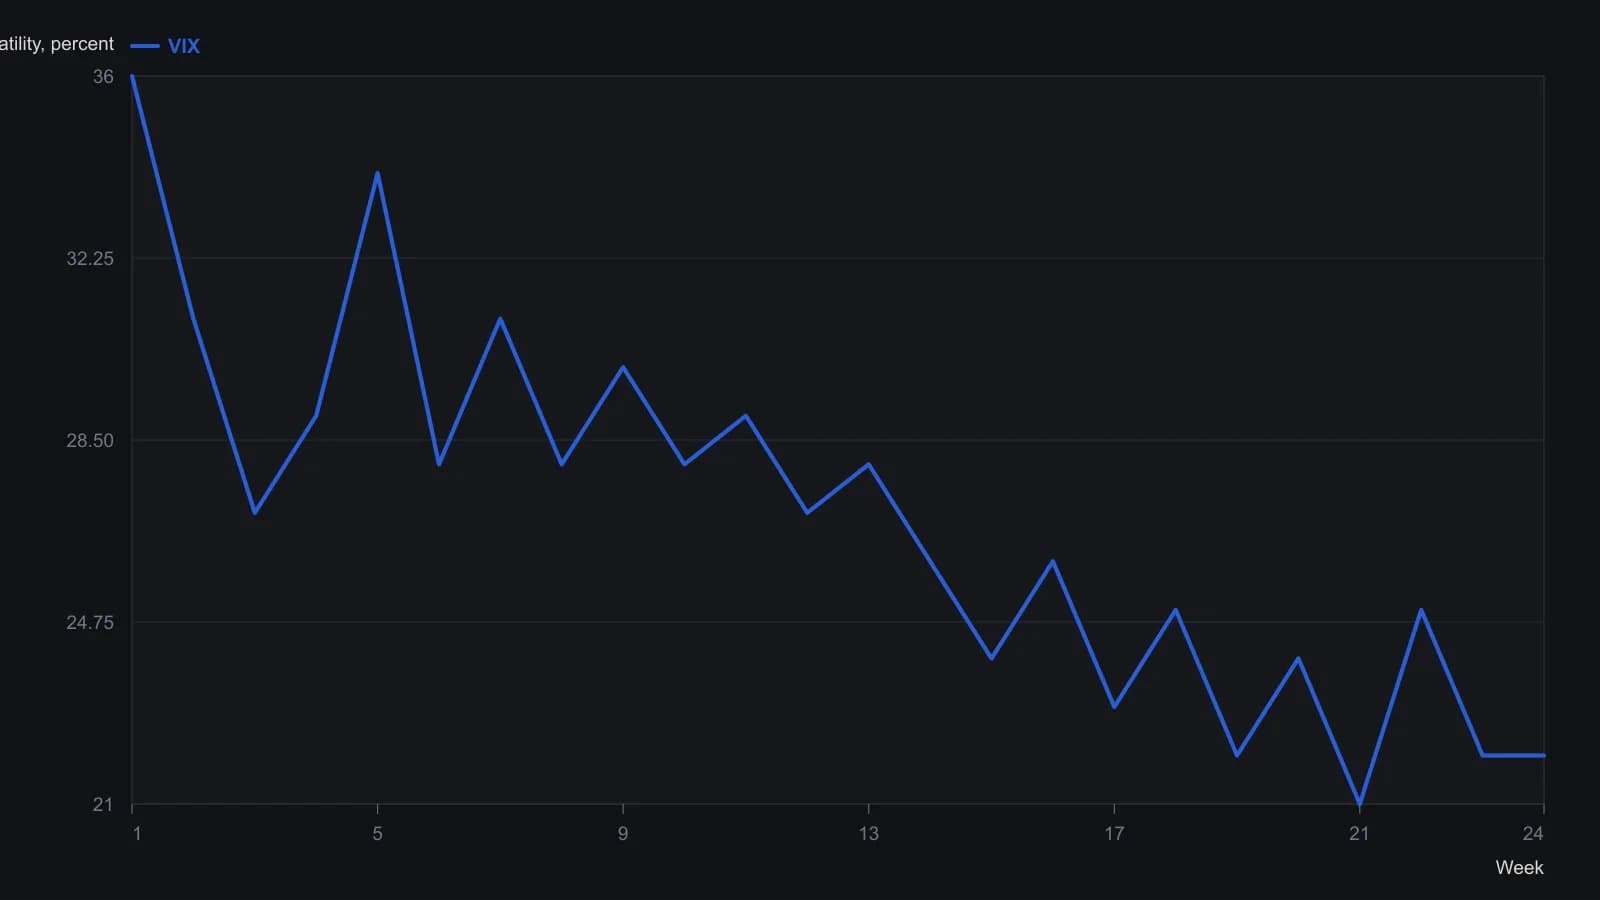
Read from the lower series against the printed left-hand scale marks at 16, 25 and 35. The raster supports about one-point accuracy; the daily wiggles were not traced point-for-point.
How the bands classify the series
Daily index values were framed with 20-day Bollinger bands defined as two standard deviations around a 20-day moving average. That placement is the band-defined-regime: a classification of the volatility series as stretched or compressed around a short moving average.
Proximity to the upper band was labeled an expensive-option regime. Proximity to the lower band was labeled inexpensive or roughly fair.
Momentum context on the same series
MACD was named as a complementary reading on the same volatility series, used to add momentum context to the band classification. The archive therefore applies the macd-overlay to the implied-volatility-index itself.
Editorial reading: the overlay tests whether a band extreme is also a momentum extreme. It is not, in the archive, a separate buy or sell mark printed on the cash index.
When the screen withholds a long stance
The index is also framed as an option-overlay-screen that withholds a conservative long OEX-option stance unless the reading sits near the lower band. The stated premise is that the risk-reward balance is adverse in the expensive zone.
A September 1993 political confrontation is cited as a case in which a falling market and a rising volatility index moved option prices into the expensive zone. A companion chart note states that the underlying market often changed direction when the volatility index reached the upper band.
All readings on this track · 45 readings
- 1992Constructing volatility-scaled bands with relative strength index confirmation
- 1994Implied volatility as a band-defined regime filter for index options
- 1995Constructing projection bands from least-squares slopes
- 1995Constructing regression projection bands and range oscillators
- 1996Constructing Bollinger bands, percent-b, and stochastics
- 1996Constructing mechanical rules from Bollinger Bands and stochastics
- 1996Constructing a standard-error envelope around a linear regression
- 1996Dual-horizon ratio envelopes and regression error channels
- 1997Rational group structure with a trend screen, RSI, and bands
- 1997Asymmetric volatility band construction
- 1998Constructing three-state filters from Bollinger band envelopes
- 1999Combination filters with Bollinger Bands and the relative strength index
- 1999Constructing stochastic timed exits and band-RSI reversals
- 1999Evaluating Bollinger Bands against fixed-width and range-based envelopes
- 2000Constructing a Bollinger Band target as a forward price
- 2001Numeric candlestick encoding with local size bands
- 2001Ranked candlestick sentiment to band-cross entries
- 2002Combining Bollinger Bands, RSI, and a stop-loss
- 2002Bollinger Bands remain filters, not forecasts
- 2002Constructing a stochastic RSI with Bollinger bands
- 2002Constructing a StochRSI and Bollinger mechanical system
- 2003Constructing volatility-scaled Bollinger envelopes
- 2003Why tick breadth fails as a market personality
- 2005Constructing Bollinger bands versus fixed trading bands
- 2006Squared versus absolute deviation in envelope construction
- 2006Confirming yen crossovers with implied volatility and bands
- 2006A daily candle reversal is a hypothesis until shorter sessions fail at the same zone
- 2008Rebuild the Relative Strength Index as price-scale bands
- 2008Reading Relative Strength Index extremes on one price axis with Bollinger Bands and moving averages
- 2011Three-filter confirmation for short-swing futures
- 2011Constructing an inverse Fisher stochastic with bands and averages
- 2012Constructing a Bollinger Band indicator suite
- 2012Stacking price extremes, crossovers, bands, and MACD
- 2012Adaptive Bollinger band impulse, trend, and momentum filters
- 2013Rescaling stochastic, percent-B, and wave-count parameters
- 2014Industry-group quartile pivots as a Bollinger Bands case study
- 2014Bollinger Bands as adaptive price envelopes: a 2014 classroom case
- 2016Trend-channel entry rules from stacked moving averages
- 2016A permission stack for Bollinger, RSI, and the 50-period average
- 2017Constructing weighted Bollinger bands and volume averages
- 2017Four swing-entry rules that share a timed exit
- 2017Two-wave monthly cycles as a regime filter
- 2019Constructing exponential-deviation-bands from a midline-average
- 2020Critiquing exponential variants of Bollinger Bands
- 2020Constructing selectable volatility and moving-average bands