2020issue C0918-23
Constructing selectable volatility and moving-average bands
A combined overlay is built so one true or false input draws either a volatility channel or a standard-deviation envelope around price, while a separate middle-line can be omitted or computed on its own settings. The same construction is described as supporting later comparison of entry and exit procedures as one testable sequence.
- One true or false input draws either a volatility-band channel or a standard-deviation envelope around price.
- In envelope mode, the upper and lower lines are a chosen deviation multiple of the standard deviation of closes around a simple moving average of closes.
- The middle-line can be omitted with a zero period or computed separately by average method and price input.
- The same overlay is described as supporting later comparison of basic then faster entry and exit procedures as one testable sequence.
A selectable band overlay
The combined overlay, scvolatilityband, is built so one true or false input draws either a volatility channel or a standard-deviation envelope around price. In the standard-deviation form, the overlay is an envelope of upper and lower lines placed a chosen number of standard deviations away from a simple moving average of closing prices. The other choice is a volatility-band, a selectable alternative envelope whose width tracks a volatility range rather than a fixed-time standard-deviation multiple.
Envelope mode
When the envelope mode is selected, upper and lower lines are a chosen deviation multiple of the standard deviation of closes around a simple moving average of closes. An illustrative envelope construction uses a 20-bar simple moving average of closes and a 2.4 standard-deviation multiple, without applying a low-band adjustment used in the other mode.
An independent middle-line
The middle-line can be omitted with a zero period or computed separately with simple, exponential, smoothed, or linear-weighted averaging on close, open, high, low, median, typical, or weighted price. That moving-average is a smoothed midline computed from a chosen lookback, average method, and price input, used as the band center or as a separate support or trend line.
A band-squeeze illustration
On a daily Nasdaq illustration, a 20-day average and 2-deviation envelope narrows when volatility falls and widens when volatility rises, with three squeezes marked in an uptrend. A band-squeeze is that narrowing of the envelope when measured volatility falls, later widening when volatility rises.
A volatility-channel illustration
A volatility-channel illustration uses a 30-day band average, a 2.4 volatility range, a 0.9 low-band adjustment, a 15-day linear-weighted midline on weighted close, and a 55-day linear-weighted line on lows.
A later testable sequence
The same overlay is described as supporting later comparison of basic then faster entry and exit procedures on matching daily Nasdaq charts and periods. A stated long-side procedure treats a break of the 15-day linear-weighted midline from the lower envelope, continued support above that line or the 55-day low average, and a close back through that average after a double top as one testable sequence. That procedure is trend-following: a rule set that opens, holds, or closes positions when price and selected averages confirm continuation rather than a standalone forecast.
Nasdaq CFD with a 20-day Bollinger middle line, 2017 uptrend
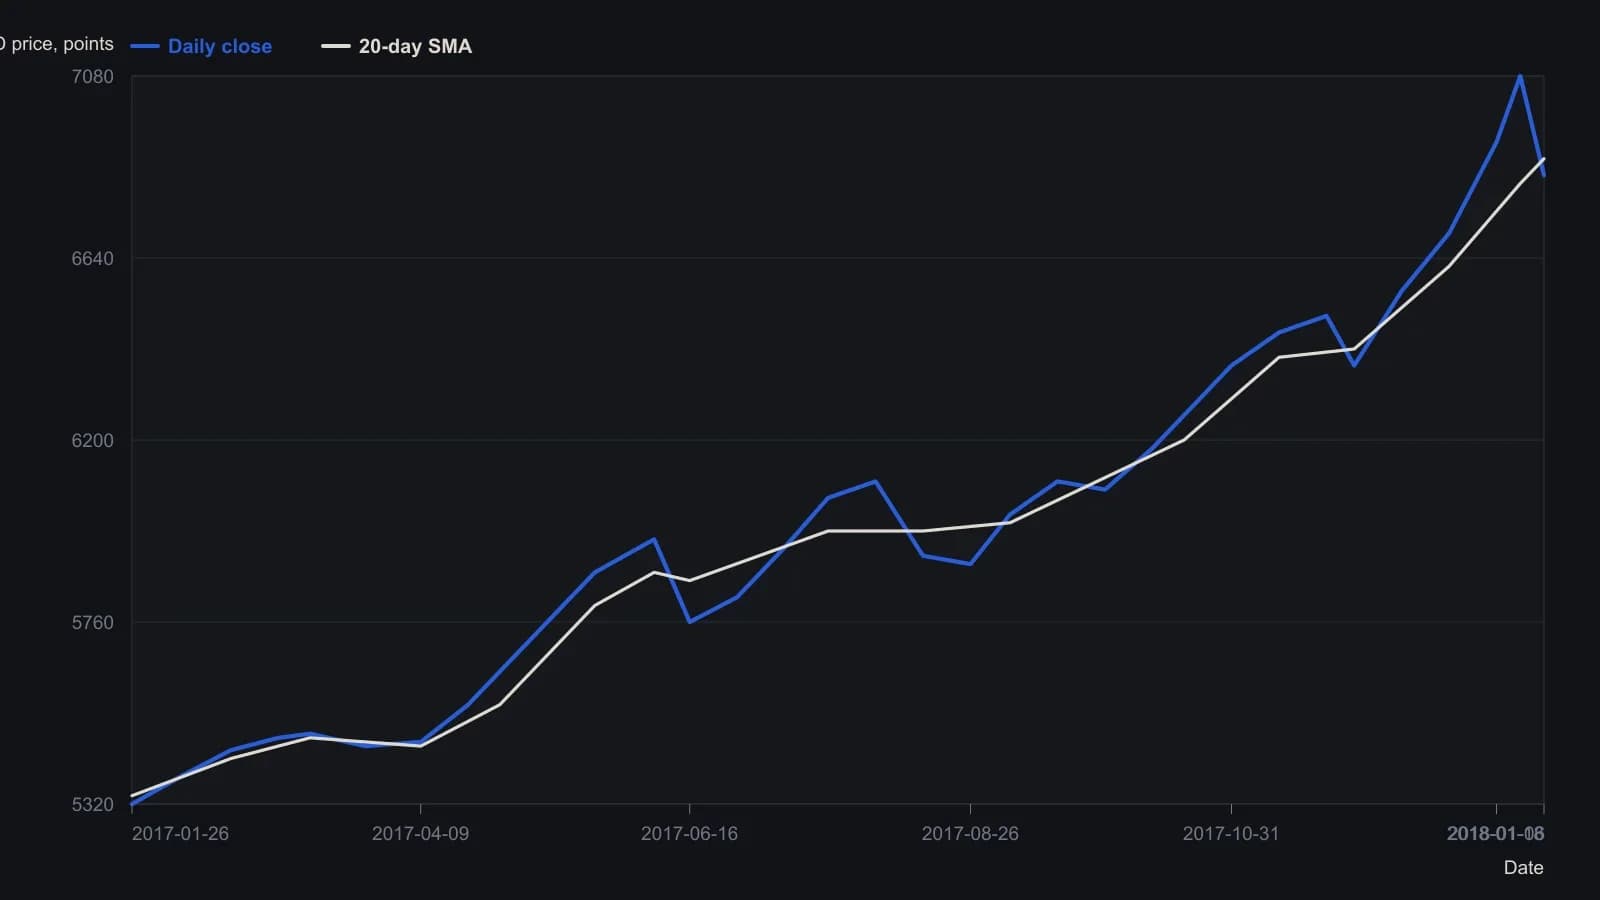
Article states Bollinger settings of a 20-day average and 2 standard deviations. Upper and lower bands are too faint on the raster to digitize, so only close and the visible middle line are returned. Prices rounded to 10 points.
All readings on this track · 45 readings
- 1992Constructing volatility-scaled bands with relative strength index confirmation
- 1994Implied volatility as a band-defined regime filter for index options
- 1995Constructing projection bands from least-squares slopes
- 1995Constructing regression projection bands and range oscillators
- 1996Constructing Bollinger bands, percent-b, and stochastics
- 1996Constructing mechanical rules from Bollinger Bands and stochastics
- 1996Constructing a standard-error envelope around a linear regression
- 1996Dual-horizon ratio envelopes and regression error channels
- 1997Rational group structure with a trend screen, RSI, and bands
- 1997Asymmetric volatility band construction
- 1998Constructing three-state filters from Bollinger band envelopes
- 1999Combination filters with Bollinger Bands and the relative strength index
- 1999Constructing stochastic timed exits and band-RSI reversals
- 1999Evaluating Bollinger Bands against fixed-width and range-based envelopes
- 2000Constructing a Bollinger Band target as a forward price
- 2001Numeric candlestick encoding with local size bands
- 2001Ranked candlestick sentiment to band-cross entries
- 2002Combining Bollinger Bands, RSI, and a stop-loss
- 2002Bollinger Bands remain filters, not forecasts
- 2002Constructing a stochastic RSI with Bollinger bands
- 2002Constructing a StochRSI and Bollinger mechanical system
- 2003Constructing volatility-scaled Bollinger envelopes
- 2003Why tick breadth fails as a market personality
- 2005Constructing Bollinger bands versus fixed trading bands
- 2006Squared versus absolute deviation in envelope construction
- 2006Confirming yen crossovers with implied volatility and bands
- 2006A daily candle reversal is a hypothesis until shorter sessions fail at the same zone
- 2008Rebuild the Relative Strength Index as price-scale bands
- 2008Reading Relative Strength Index extremes on one price axis with Bollinger Bands and moving averages
- 2011Three-filter confirmation for short-swing futures
- 2011Constructing an inverse Fisher stochastic with bands and averages
- 2012Constructing a Bollinger Band indicator suite
- 2012Stacking price extremes, crossovers, bands, and MACD
- 2012Adaptive Bollinger band impulse, trend, and momentum filters
- 2013Rescaling stochastic, percent-B, and wave-count parameters
- 2014Industry-group quartile pivots as a Bollinger Bands case study
- 2014Bollinger Bands as adaptive price envelopes: a 2014 classroom case
- 2016Trend-channel entry rules from stacked moving averages
- 2016A permission stack for Bollinger, RSI, and the 50-period average
- 2017Constructing weighted Bollinger bands and volume averages
- 2017Four swing-entry rules that share a timed exit
- 2017Two-wave monthly cycles as a regime filter
- 2019Constructing exponential-deviation-bands from a midline-average
- 2020Critiquing exponential variants of Bollinger Bands
- 2020Constructing selectable volatility and moving-average bands