2016issue C0146-56
Trend-channel entry rules from stacked moving averages
A 50-day market filter, stacked moving-average alignment, and an 8-day high-low channel can be written as one Rule-based entry procedure. The same conditions can screen names and time the trade.
- A 50-day simple moving average on a broad market proxy can sort candidate stocks into uptrend or downtrend setups before any entry is considered.
- Long-side screening can require price above its 50-day average, a 20-day average above the 50-day average, and a 50-day average above the 200-day average.
- Long entry and exit can sit on a two-line channel from an 8-day average of highs and an 8-day average of lows.
- Turning the market-trend screen or the 50-versus-200 alignment off changes the trade list and can block an entire class of short entries.
One testable procedure
The archive workflow uses a market-direction filter, stacked moving-average alignment, and a two-line channel to decide which stocks are eligible and when a long trade is opened or closed.
Editorial: treat those pieces as one Rule-based entry procedure rather than as three separate ideas. Candidate selection and trade execution then stay on the same conditions.
Market direction and stacked averages
A 50-day simple moving average on a broad market proxy can be used as the first filter for whether candidate stocks are treated as uptrend or downtrend setups.
Long-side screening can require price above its 50-day average, a 20-day average above the 50-day average, and a 50-day average above the 200-day average.
The same stacked-average alignment can be inverted for short-side setups: a 20-day average below the 50-day average and a 50-day average below the 200-day average, only when the market-direction filter is negative.
Channel entry and exit
Entry and exit can be reduced to a two-line channel built from an 8-day average of highs and an 8-day average of lows, with long entry on a close above the upper line and long exit when price undercuts the lower line.
Shared rules and optional filters
The procedure can be coded as both a scanner and indicator and a backtestable strategy so that candidate selection and trade execution are the same rule set.
Volume can be added as a liquidity screen, such as requiring 50-day average volume greater than one million shares before a name is eligible.
Turning individual setup filters on or off, including the market-trend screen and the 50-versus-200 average alignment, changes which trades appear and can block an entire class of short entries.
Average trade result versus the NASDAQ 100, 2000–2015
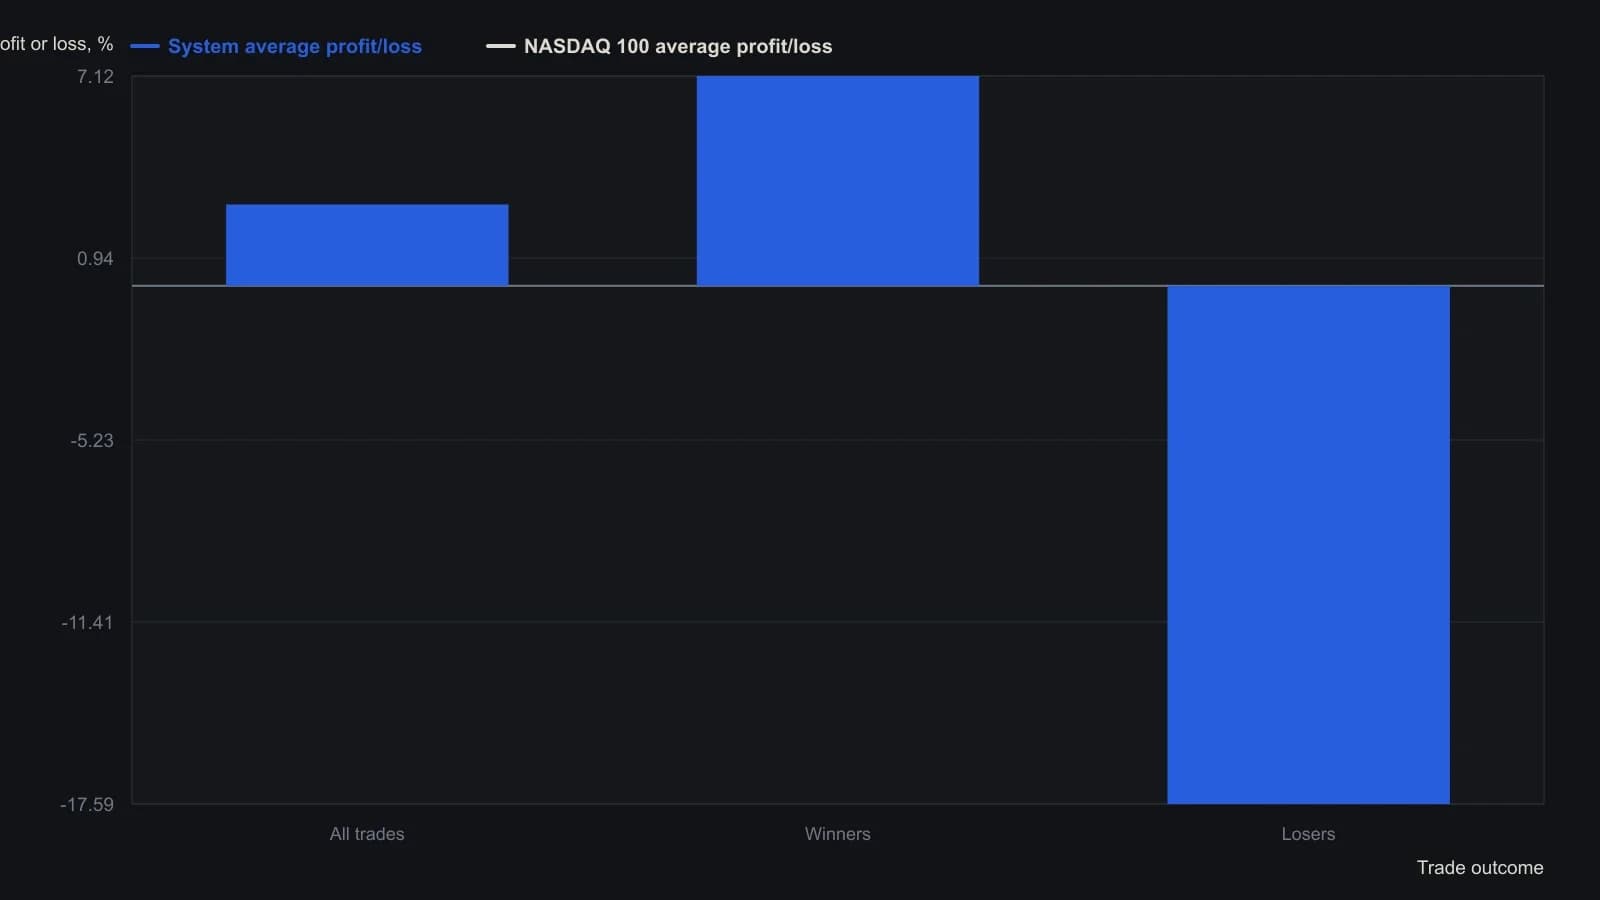
The AIQ run added an 80 percent profit-protect exit once a position was up 5 percent, used NASDAQ 100 names, and applied the authors’ band and trend filters plus extra exits not in the original article.
All readings on this track · 45 readings
- 1992Constructing volatility-scaled bands with relative strength index confirmation
- 1994Implied volatility as a band-defined regime filter for index options
- 1995Constructing projection bands from least-squares slopes
- 1995Constructing regression projection bands and range oscillators
- 1996Constructing Bollinger bands, percent-b, and stochastics
- 1996Constructing mechanical rules from Bollinger Bands and stochastics
- 1996Constructing a standard-error envelope around a linear regression
- 1996Dual-horizon ratio envelopes and regression error channels
- 1997Rational group structure with a trend screen, RSI, and bands
- 1997Asymmetric volatility band construction
- 1998Constructing three-state filters from Bollinger band envelopes
- 1999Combination filters with Bollinger Bands and the relative strength index
- 1999Constructing stochastic timed exits and band-RSI reversals
- 1999Evaluating Bollinger Bands against fixed-width and range-based envelopes
- 2000Constructing a Bollinger Band target as a forward price
- 2001Numeric candlestick encoding with local size bands
- 2001Ranked candlestick sentiment to band-cross entries
- 2002Combining Bollinger Bands, RSI, and a stop-loss
- 2002Bollinger Bands remain filters, not forecasts
- 2002Constructing a stochastic RSI with Bollinger bands
- 2002Constructing a StochRSI and Bollinger mechanical system
- 2003Constructing volatility-scaled Bollinger envelopes
- 2003Why tick breadth fails as a market personality
- 2005Constructing Bollinger bands versus fixed trading bands
- 2006Squared versus absolute deviation in envelope construction
- 2006Confirming yen crossovers with implied volatility and bands
- 2006A daily candle reversal is a hypothesis until shorter sessions fail at the same zone
- 2008Rebuild the Relative Strength Index as price-scale bands
- 2008Reading Relative Strength Index extremes on one price axis with Bollinger Bands and moving averages
- 2011Three-filter confirmation for short-swing futures
- 2011Constructing an inverse Fisher stochastic with bands and averages
- 2012Constructing a Bollinger Band indicator suite
- 2012Stacking price extremes, crossovers, bands, and MACD
- 2012Adaptive Bollinger band impulse, trend, and momentum filters
- 2013Rescaling stochastic, percent-B, and wave-count parameters
- 2014Industry-group quartile pivots as a Bollinger Bands case study
- 2014Bollinger Bands as adaptive price envelopes: a 2014 classroom case
- 2016Trend-channel entry rules from stacked moving averages
- 2016A permission stack for Bollinger, RSI, and the 50-period average
- 2017Constructing weighted Bollinger bands and volume averages
- 2017Four swing-entry rules that share a timed exit
- 2017Two-wave monthly cycles as a regime filter
- 2019Constructing exponential-deviation-bands from a midline-average
- 2020Critiquing exponential variants of Bollinger Bands
- 2020Constructing selectable volatility and moving-average bands